
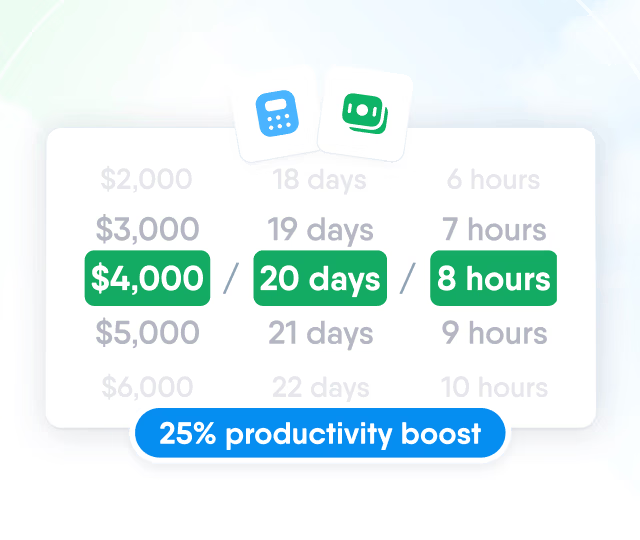
HR efficiency estimator
How does the HR efficiency estimator from PeopleForce work.
Calculate your impact



Metrics
What are HR metrics?
Metrics are the measurements a team uses to tell whether its work is changing anything. In HR that means the numbers behind hiring, retention, absence, pay and engagement: how many people joined and left, how long a vacancy stayed open, how much of the payroll went to overtime, how teams answered the last survey. Each one turns a general impression of the organisation into something you can compare across months, departments and locations.
The useful test is not whether a number can be calculated, but whether anyone would act differently depending on the result. Turnover at 9% and turnover at 24% lead to different hiring budgets, different manager conversations and different priorities for the year. A number nobody would act on is reporting overhead, and most HR dashboards carry several of them.
Metrics, KPIs and HR analytics
The three terms get used interchangeably and mean different things. A metric is any consistent measurement. A key performance indicator is the small subset that carries a target and an owner, so falling short of it triggers a response. HR analytics is the work of explaining why a metric moved and what it means, while predictive HR analytics uses the same history to estimate what happens next. The HR dashboard is simply where all of it surfaces.
The metrics most HR teams start with
A first set usually covers four questions: who is here, who is leaving, how fast you replace them, and what it costs.
- Headcount and its movement by department, location and employment type. Almost everything else is calculated against it, so it has to be right first.
- Turnover rate, split into voluntary and involuntary. A single blended figure hides the difference between people choosing to leave and the company letting them go.
- Retention rate for the groups you cannot afford to lose: first-year hires, senior engineers, client-facing roles.
- Time to hire and time to fill. The first measures the candidate experience, the second measures the business cost of an empty seat.
- Quality of hire, usually a composite of probation pass rate, first-year retention and the manager's rating at six months.
- Absence rate, read alongside the absenteeism policy so everyone knows which days are counted.
- eNPS and survey participation, which tell you both how people feel and whether they still believe answering changes anything.
- Revenue per employee, the one figure on this list a finance director will recognise immediately.
Getting the formulas right
Most arguments about HR numbers are arguments about denominators, not about arithmetic.
- Turnover rate = leavers in the period divided by average headcount in the same period, times 100. Using closing headcount instead of the average inflates the figure in a shrinking company and deflates it in a growing one.
- Time to fill runs from the approved vacancy request to the signed offer. Time to hire runs from the candidate's first contact to the same point, which is why the two rarely match.
- Absence rate = absence days divided by scheduled working days, times 100. Counting calendar days instead of working days makes every part-time team look worse than it is.
- Cost per hire = internal plus external recruiting spend divided by the number of hires. Decide once whether referral bonuses and recruiter salaries sit inside the number, then do not change it mid-year.
What makes a metric trustworthy
Write the definition down before the first report goes out: the date range, the population, the exclusions. Segment everything, because a stable company-wide turnover figure often hides one department losing a third of its people. Set a cadence and hold it, since a metric produced only when someone asks for it has no baseline to compare against. And keep segments large enough to mean something: 50% turnover in a team of four is two leavers, not a crisis.
Where HR metrics programmes go wrong
The usual pattern is a dashboard that grows every quarter and is read less every quarter. It happens when teams measure what the system exports rather than what the business asked about, compare themselves to benchmarks drawn from different industries and company sizes, or publish a number with no owner and no decision attached to it. The fix is unglamorous: cut the set down to the handful of metrics that have changed a decision in the past year, and put a name next to each one.
HR metrics in PeopleForce
PeopleForce analytics builds these numbers out of the records teams already keep instead of a parallel spreadsheet. Core HR reporting covers headcount, turnover, tenure, onboarding and offboarding, leave balance and leave used, working hours, payroll and the gender pay gap. Recruit adds the hiring side: pipeline funnel and movements, candidate sources, time in stage, time to fill, time to hire and time to disqualify. Perform contributes KPI results, objective ownership, development plans and one-on-one coverage, and Pulse supplies eNPS and mood data. Every report can be filtered and segmented, exported as XLSX or CSV, and put on a recurring schedule so it lands in the right inboxes instead of being rebuilt by hand each month.


Let us show you what's possible
From Core HR to advanced workforce analytics — see the platform saving 80 hours a month for teams just like yours. Fully tailored to your workflow.