New n-box matrix for succession planning and improved competencies
In-depth company analysis allows finding weak and also strong sides, and provides new opportunities for better planning. The well-known 9-box matrix is used across hundreds of enterprises for reviews, but in some cases it is limited when a company wants to have more granular information about their employees.
In our previous PeopleForce system versions, users were limited to an ordinary 9-box matrix that grouped answers into 9 boxes, and it worked well if every question had 3 possible answers. But when we have 4 or more answers on the question, multiple closely related answers from employees could get into the same box, where in fact answers can be different and must be separated for better data representation on the grid.
n-box matrix methodology
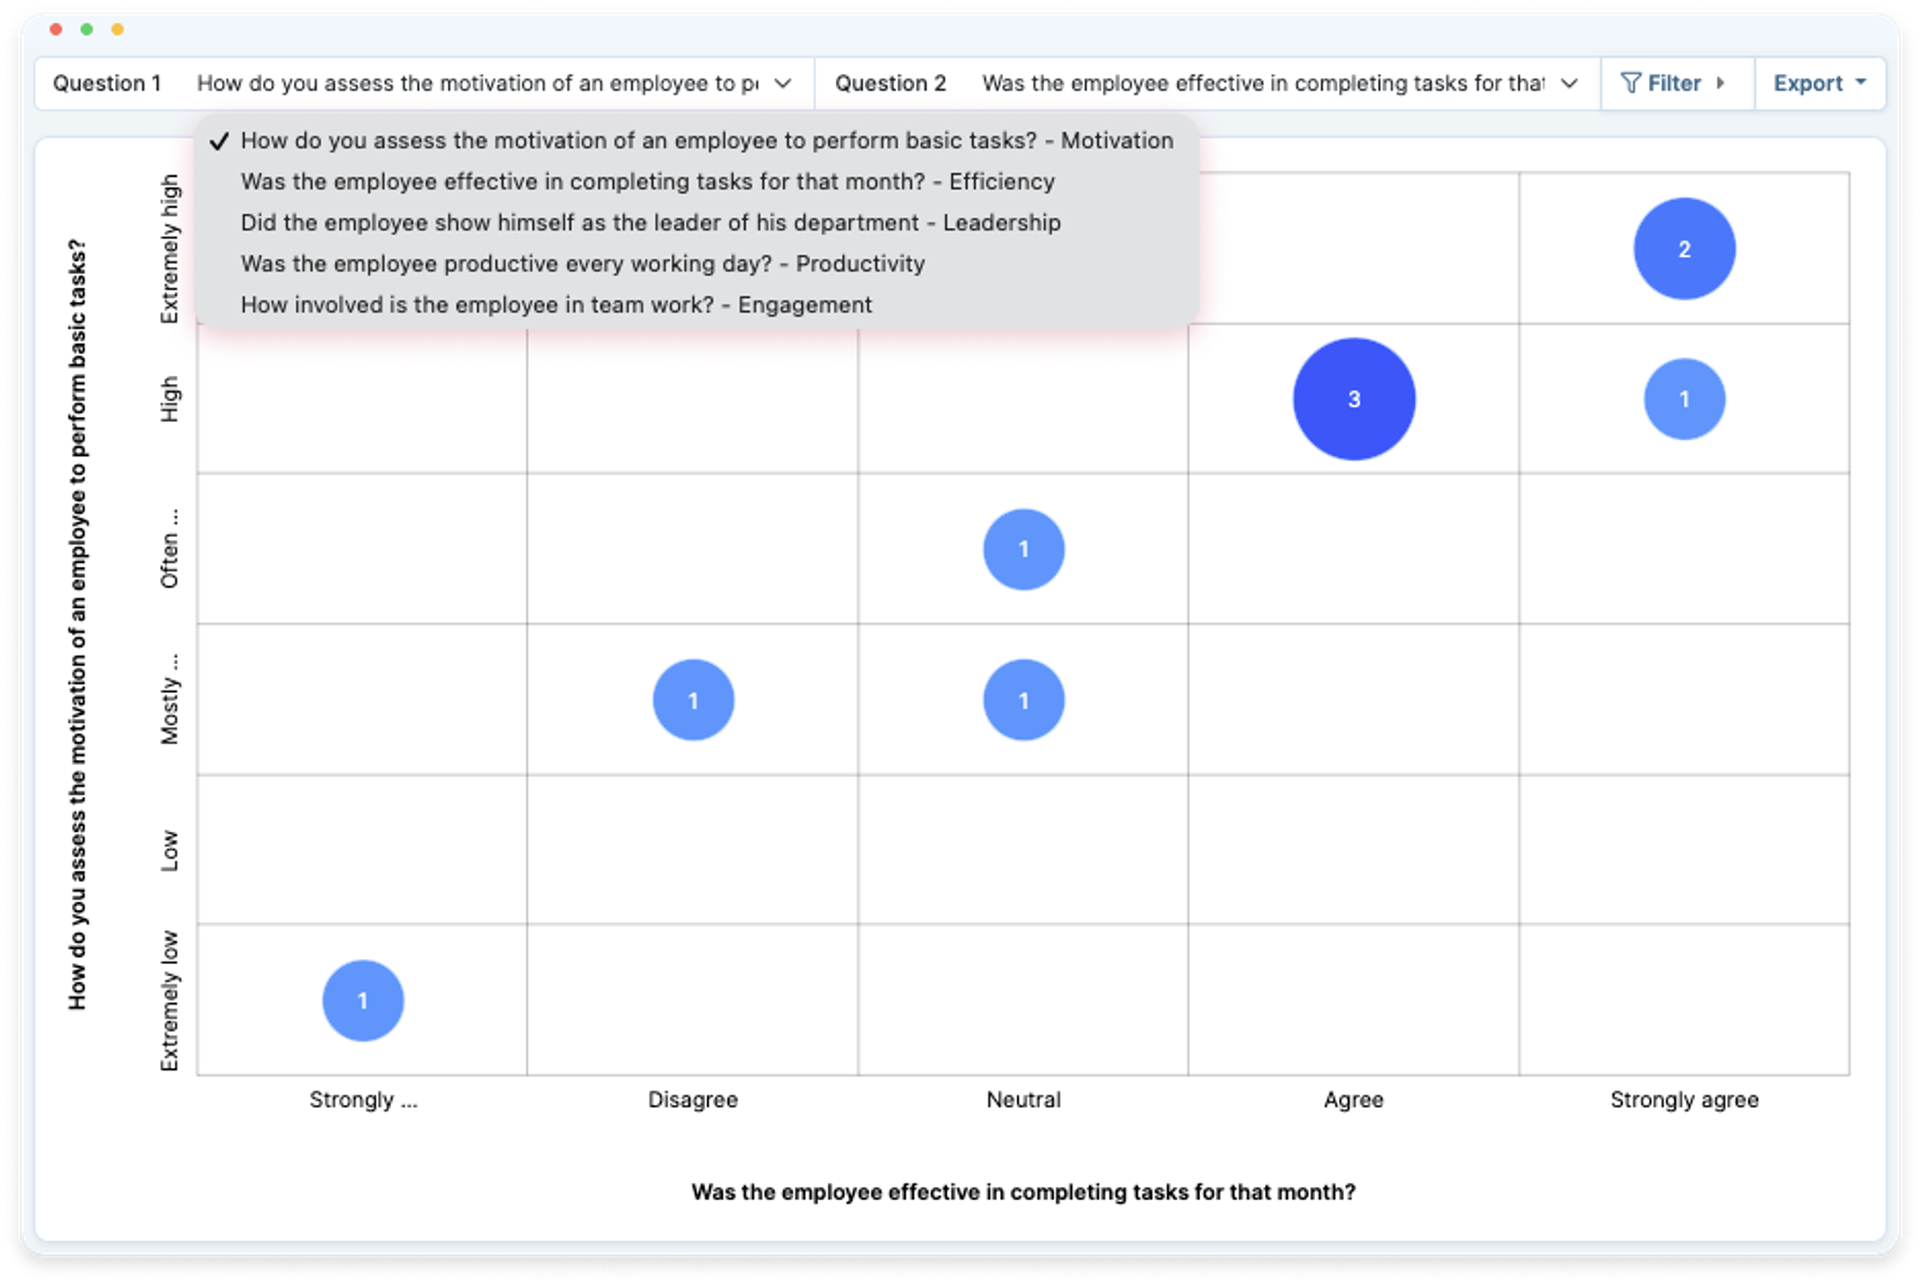
The new n-box methodology brings flexibility that many companies need, but to be more specific, now it is possible to build any quantity of boxes depending on the number of answers for each question. In other words it means that for every answer, a new box is built on the grid. Furthermore, this change also introduces the possibility of adding the custom number of rating answers associated with a question used for a review.
If we compare the n-box and 9-box methodologies, the latter has a flaw of grouping multiple answers into one box if more than 3 answers for a question are used. On the other hand, the n-box can display all answers separately, providing insights that companies couldn’t see due to slightly diluted data representation.
Furthermore, the 9-box matrix compares potential against performance, but what if we want to compare loyalty against company involvement? Or any other set of qualities that employees express in their day-to-day duties, and unfortunately the 9-box limits us from doing that.
On the contrary, the new n-box grid also allows creating any number of rating questions that can be compared against each other right on the grid. Users can switch between the desired questions, and the grid will display all rating answers provided by employees. Now we have the possibility to compare one question against multiple variants, and find interesting insights about our employees.
Competencies
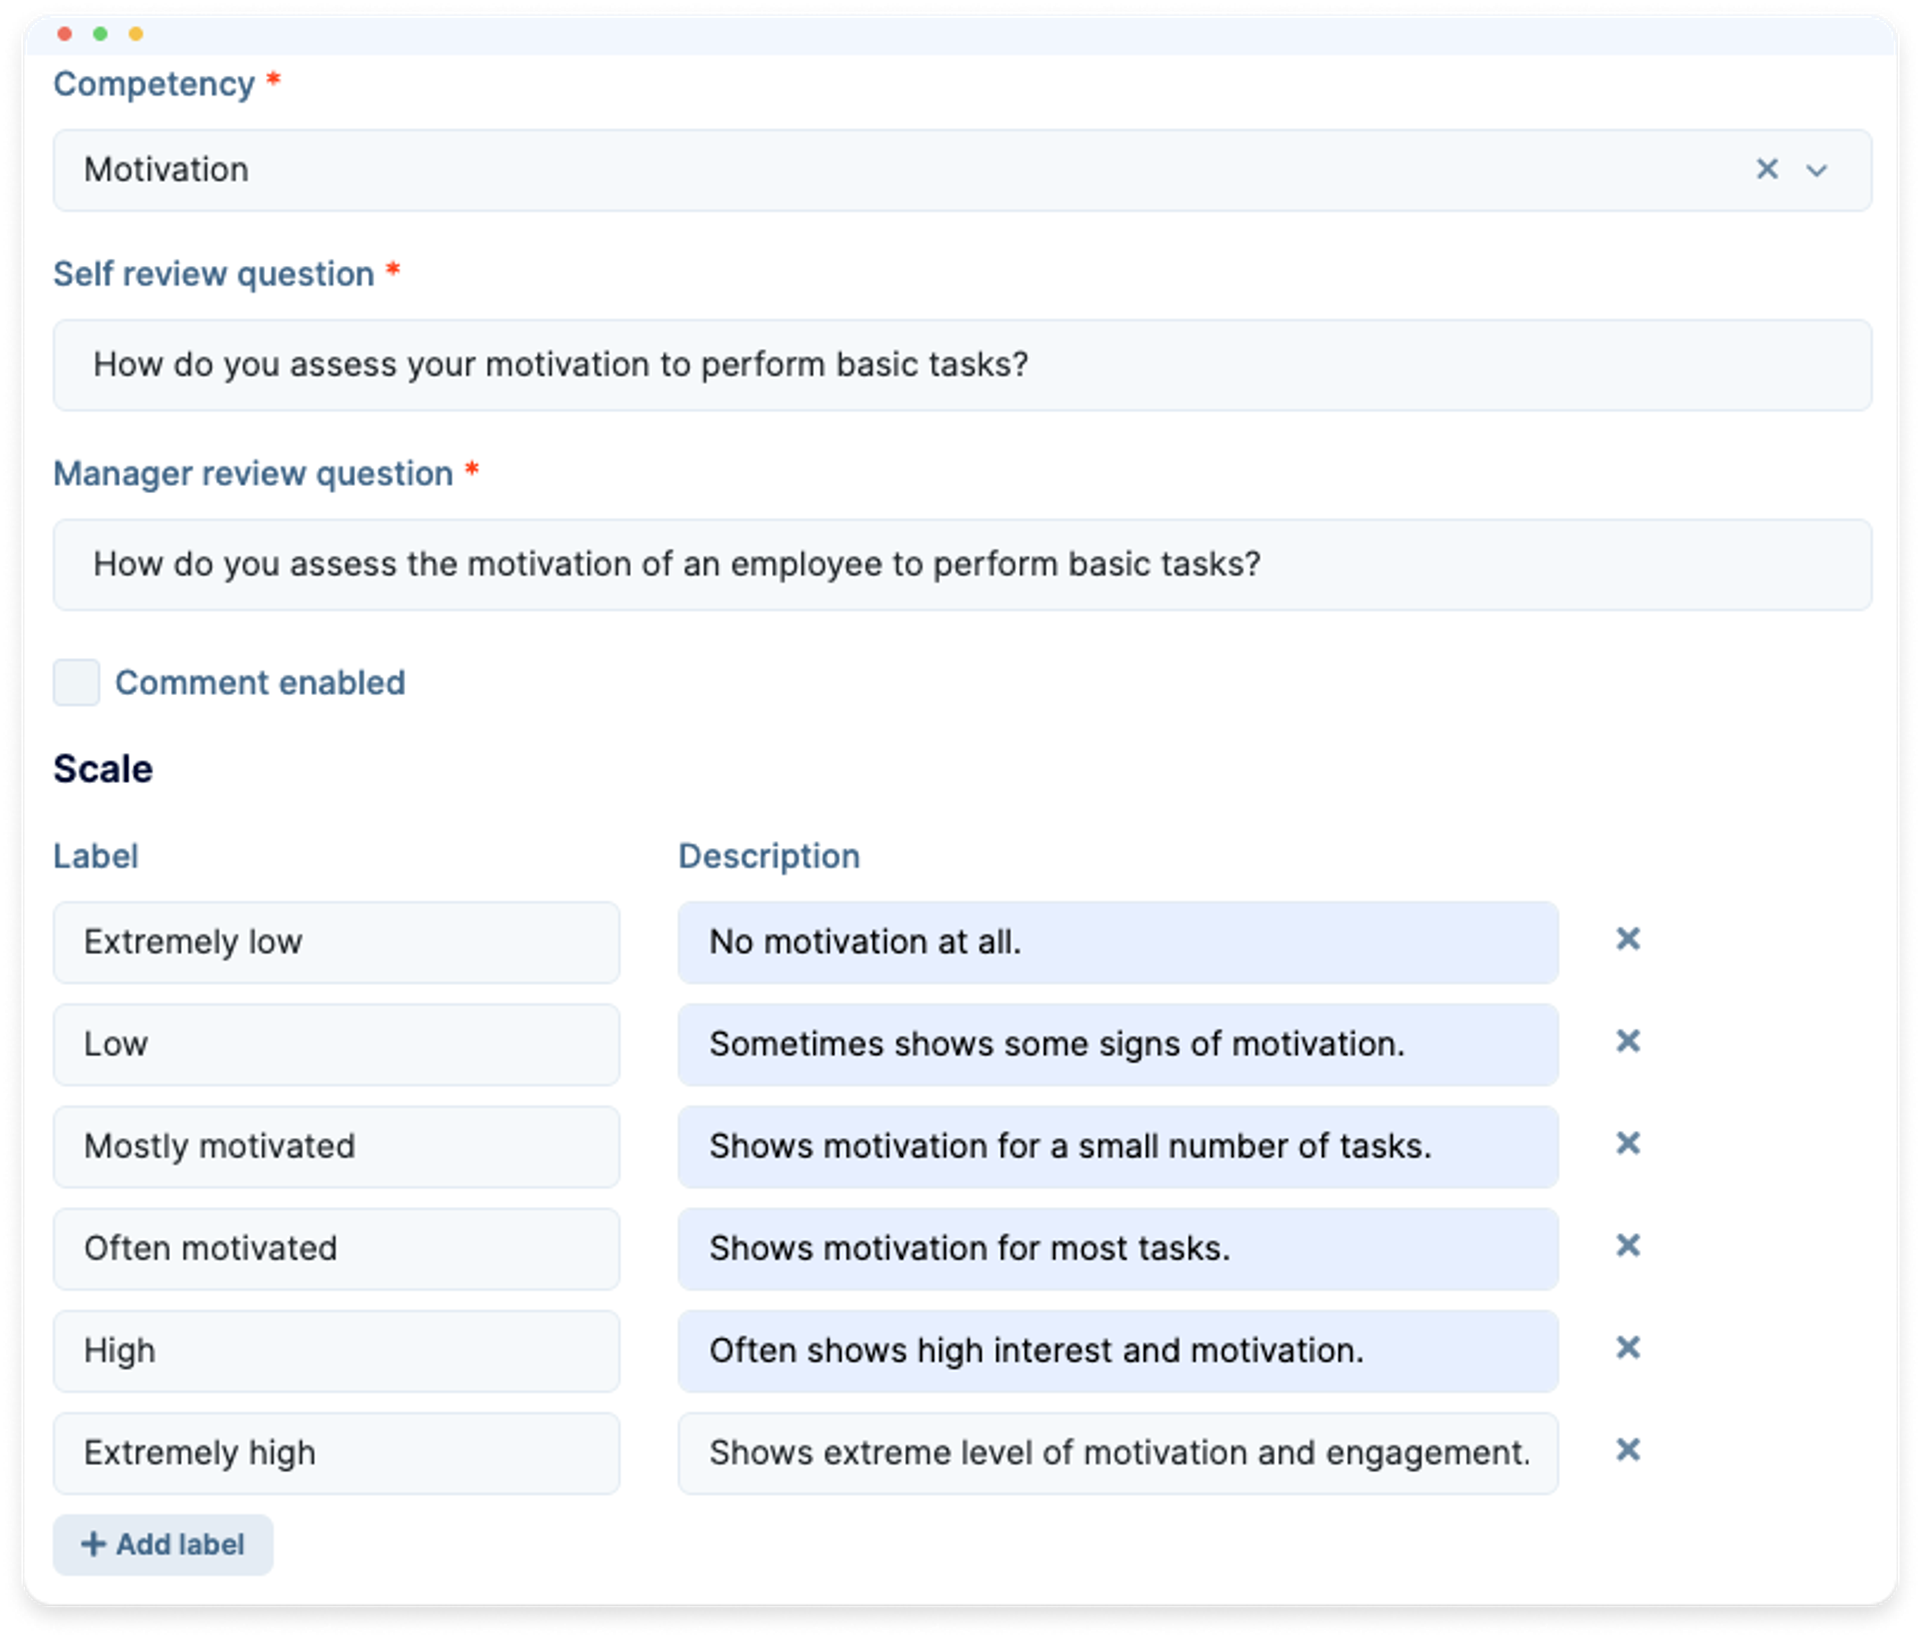
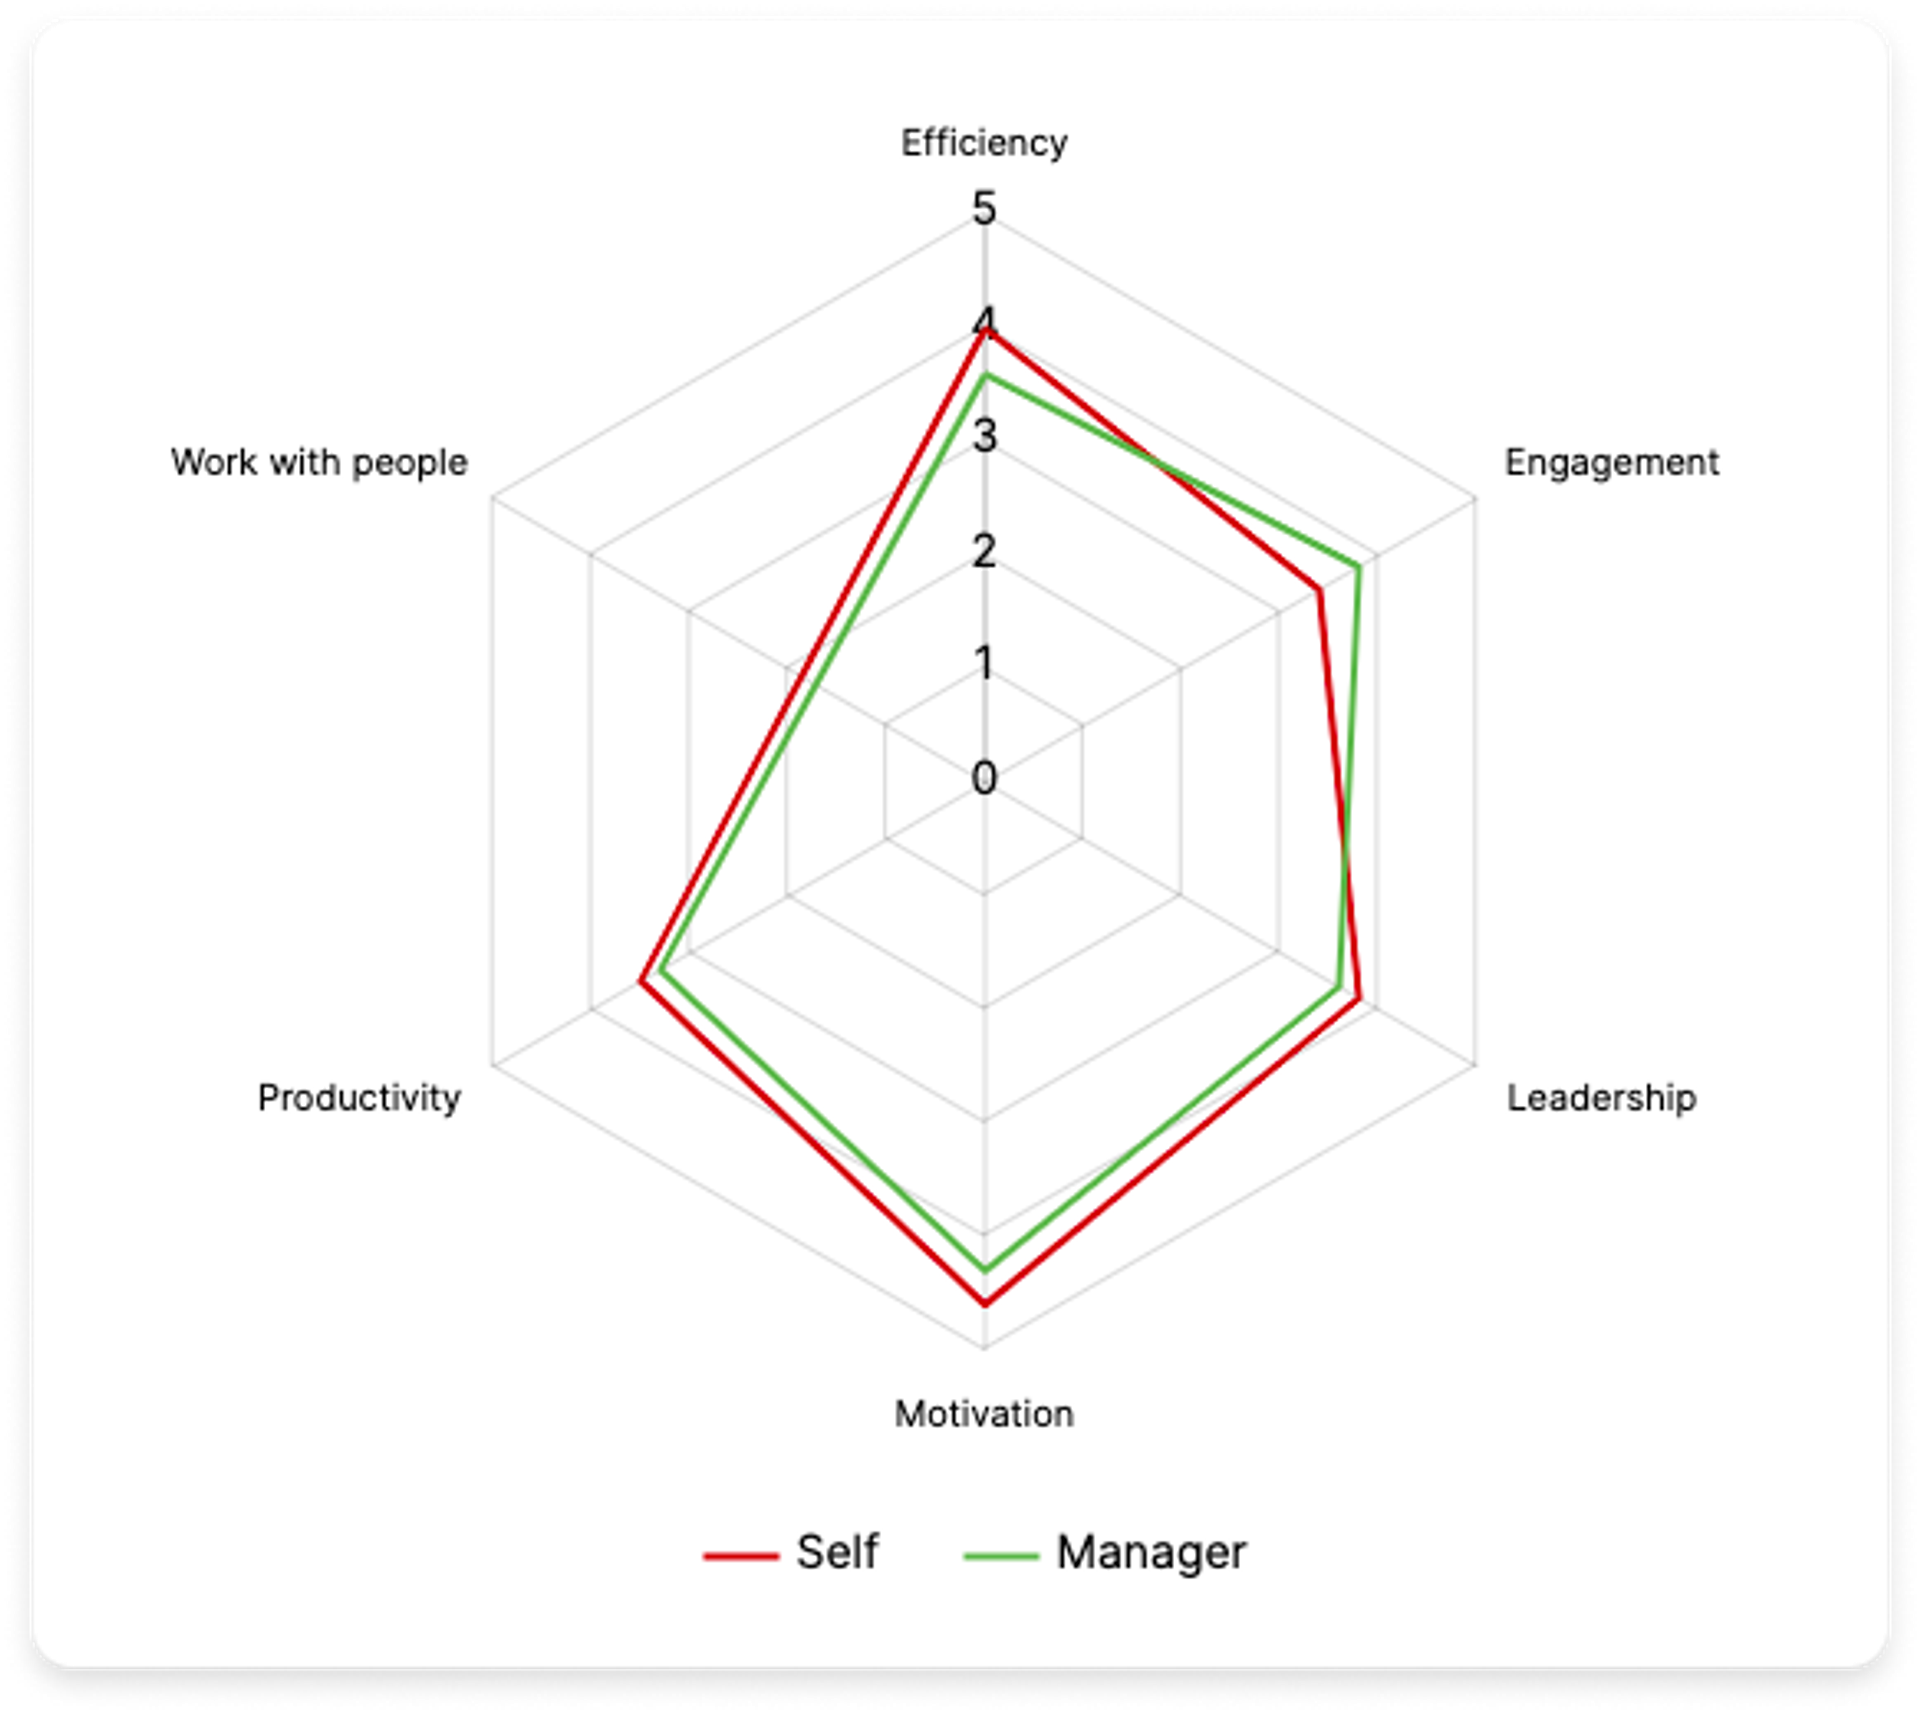
Competencies within the company determine how effectively teams can resolve problems. And it is important to keep in mind that every competency can be improved, if any issues are found. But in order to find these issues efficiently, we have introduced the new competencies grid that displays the answers of employees and groups them accordingly.
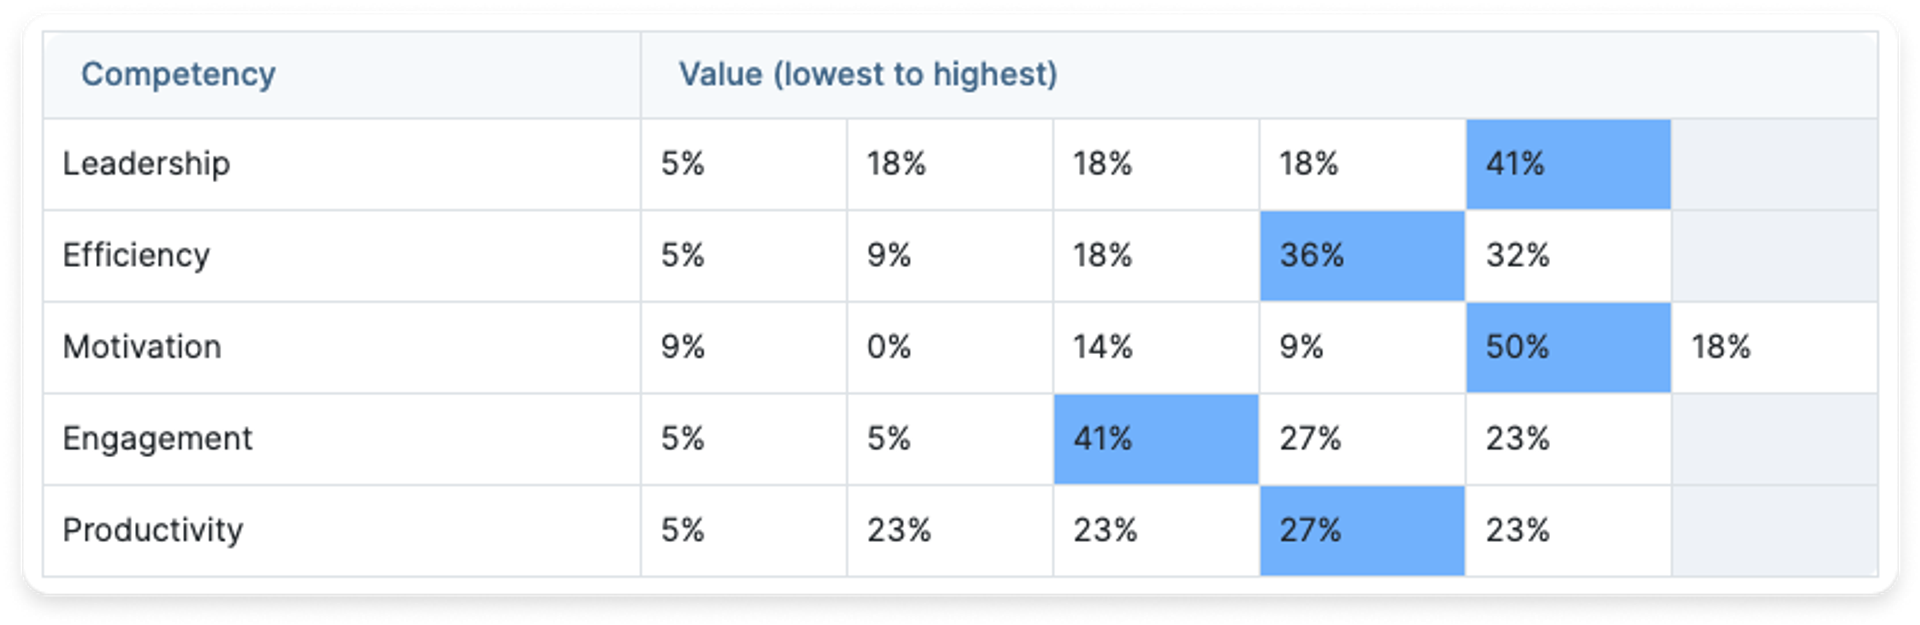
This grid helps to divide all employees into groups that clearly show how well their competencies are developed. Managers can take advantage of this grid and create training sessions to improve, for instance, the leadership or any other qualities.
Down below the grid you can also find data represented as average numbers for every competency. This is very helpful to quickly summarise information across multiple competencies.
Schedule a trial period for PeopleForce, check out our past updates on the blog, and stay tuned for new releases in the PeopleForce Library.
Recent updates
A fresh feel for PeopleForce: UX updates you’ll notice
We’re rolling out a set of UX improvements designed to make PeopleForce feel lighter, calmer, and easier to use every day — for you and your employees.
Get ready for the EU Pay Transparency Directive with PeopleForce
Discover the key obligations of the Pay Transparency Directive and see how PeopleForce helps organisations prepare the structures, processes, and data needed to comply with the new requirements.
Fresh features to boost your performance reviews and goal-setting by the end of 2025
As the goal-setting and performance review season approaches, it’s the perfect time to ensure your processes are smooth, insightful, and motivating for every employee.