
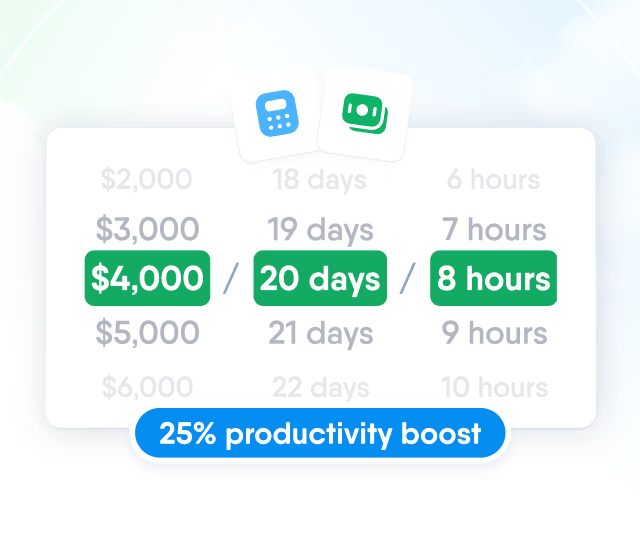
HR efficiency estimator
How does the HR efficiency estimator from PeopleForce work.
Calculate your impact



Employee net promoter score (eNPS)
What is eNPS and how do you calculate it?
eNPS (employee net promoter score) is a metric that shows how likely employees are to recommend their company as a place to work. It is calculated from answers to a single question on a 0 to 10 scale, and the result ranges from −100 to +100.
What is eNPS?
eNPS is an employee loyalty metric adapted from the customer Net Promoter Score. Employees answer one question: “How likely are you to recommend our company as a place to work to a friend?” on a scale from 0 to 10. It is quick to collect and easy to compare across teams and over time, so many companies use it as a regular pulse check on employee engagement.
Promoters, passives and detractors
| Group | Score | What it means |
|---|---|---|
| Promoters | 9–10 | Loyal employees who would recommend the company |
| Passives | 7–8 | Generally satisfied, but open to a better offer |
| Detractors | 0–6 | Unhappy employees who would not recommend the company |
eNPS formula and calculation example
eNPS = % promoters − % detractors
Passives count towards the total number of responses but are neither added nor subtracted.
Example. 200 employees answer the survey: 90 give 9–10, 60 give 7–8 and 50 give 0–6.
- Promoters: 90 / 200 = 45%
- Detractors: 50 / 200 = 25%
- eNPS = 45 − 25 = +20
What is a good eNPS score?
| eNPS | How to read it |
|---|---|
| Below 0 | More detractors than promoters: time to find out why |
| 0 to 20 | Acceptable, with room to improve |
| 20 to 50 | Good |
| Above 50 | Excellent loyalty |
These ranges are a rough guide. Comparing your score with your own previous results and across teams tells you more than comparing with other companies.
How to run an eNPS survey
- Keep it anonymous, or scores will be inflated.
- Add an open question such as “What is the main reason for your score?”. It explains the number.
- Run it regularly, for example every quarter, to see the trend.
- Share the results with the team and say what will change.
eNPS vs NPS
NPS measures customer loyalty: whether customers would recommend a product. eNPS uses the same scale and formula, but asks employees about the company as an employer. The two are often linked, because loyal employees tend to serve customers better.
eNPS in PeopleForce
The Pulse module has a dedicated eNPS survey that can run automatically every quarter or every year, with the score calculated for you. You can view eNPS by team segment and over a chosen period of 3, 6 or 12 months to see where loyalty is rising and where it is falling.
FAQ
What does eNPS stand for?
Employee net promoter score: the share of employees who would recommend the company (9–10) minus the share who would not (0–6).
How often should you measure eNPS?
Usually every quarter or every six months. More often tires employees; less often means you miss changes.
Is eNPS a percentage?
No. It is calculated from percentages, but the result is written as a number from −100 to +100.


Let us show you what's possible
From Core HR to advanced workforce analytics — see the platform saving 80 hours a month for teams just like yours. Fully tailored to your workflow.