Key performance indicators (KPIs)
Leveraging KPIs empowers your employees to visualize and attain their goals, enhancing overall team effectiveness and enabling performance tracking for Performance Reviews.
Trusted by 1600+ tech and fast-growing companies


Discover how PeopleForce can benefit your HR operations
When I looked for the new HRMS, I was impressed with the flexibility of PeopleForce, where you can make whatever you need: access rights, automated flows, leave policies, recruitment process, and performance reviews can be configured precisely how you need them. The UI is intuitive, so new users adapt very quickly.
Join over 1600 companies that already trust PeopleForce
Flexible customization to meet your needs
Ongoing communication with our team
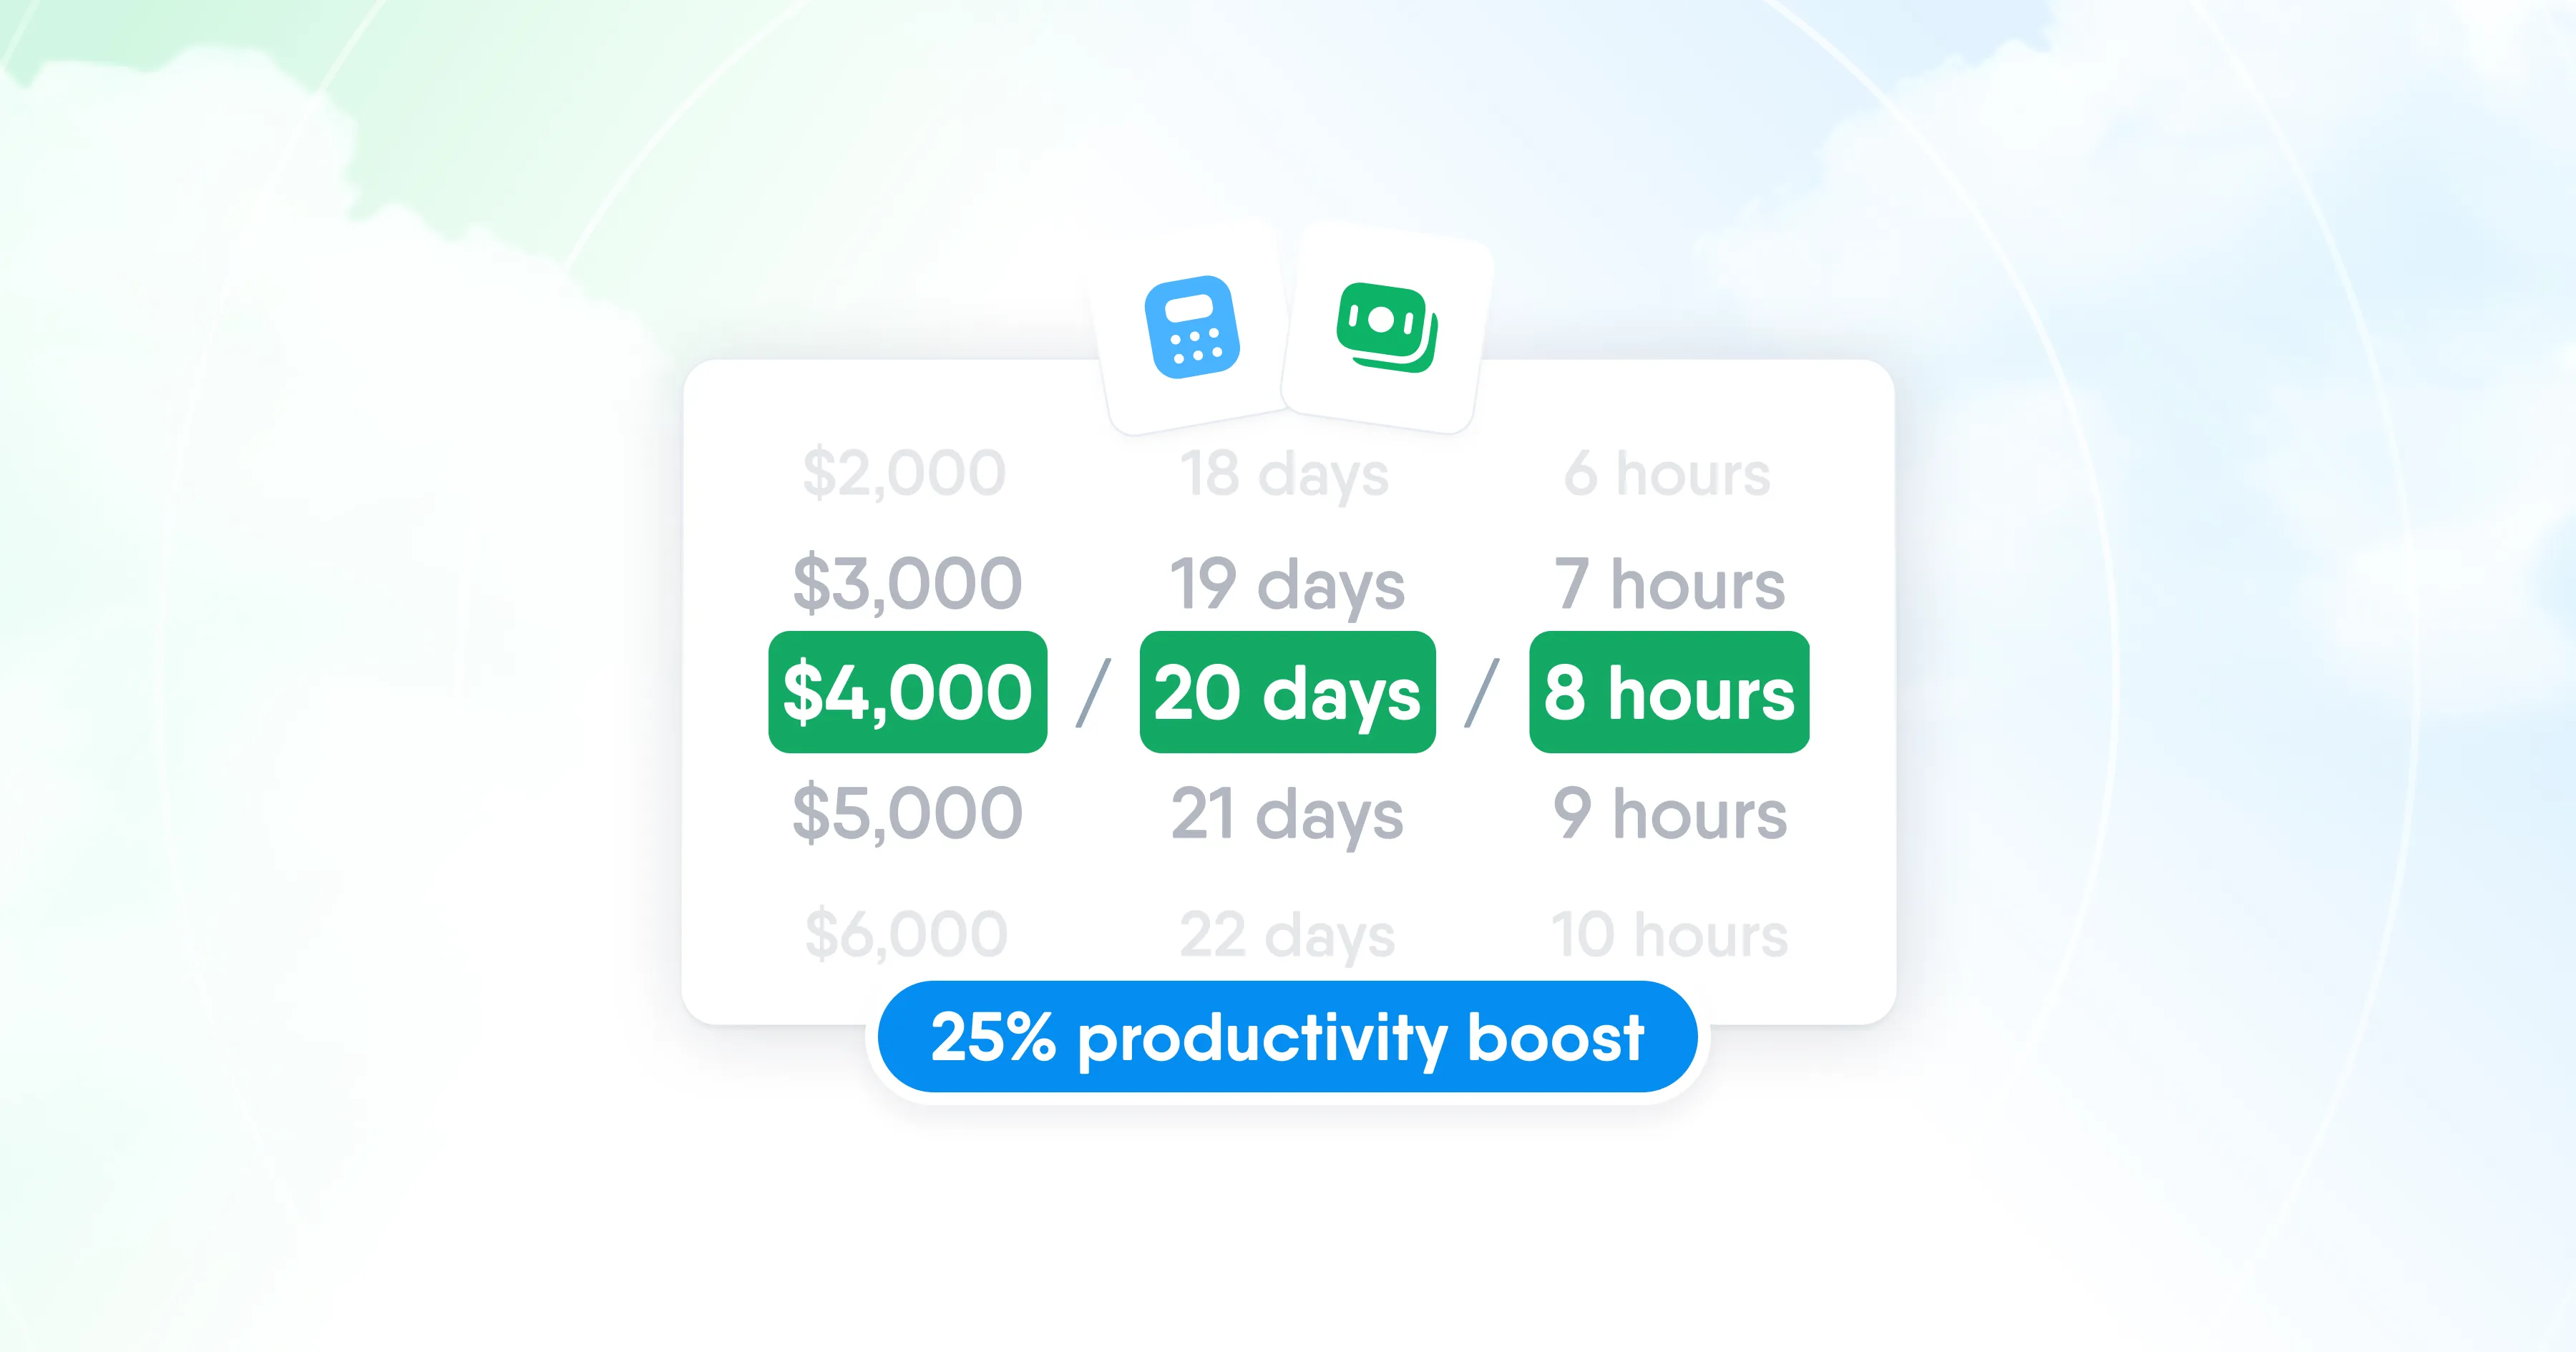
Simplify your HR processes by up to 30% per month.
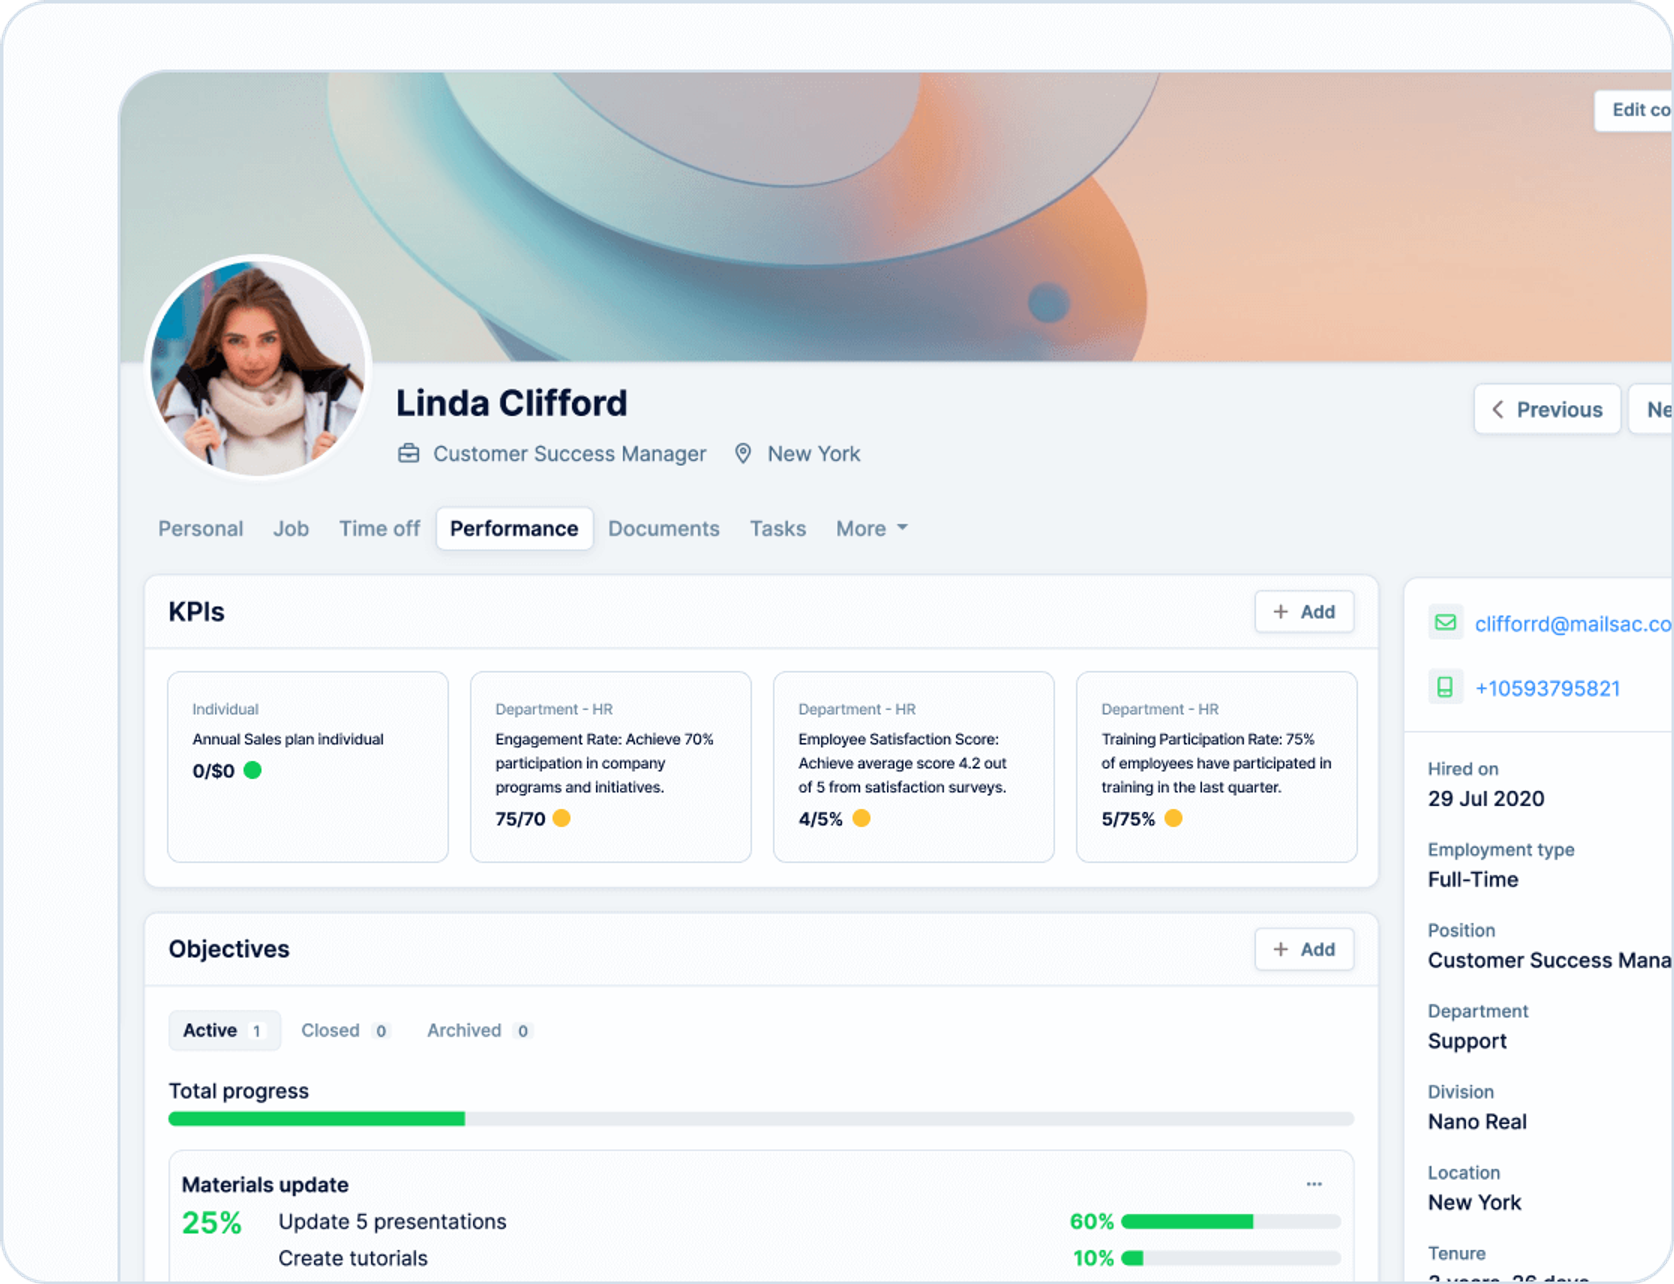
Track and evaluate employee performance
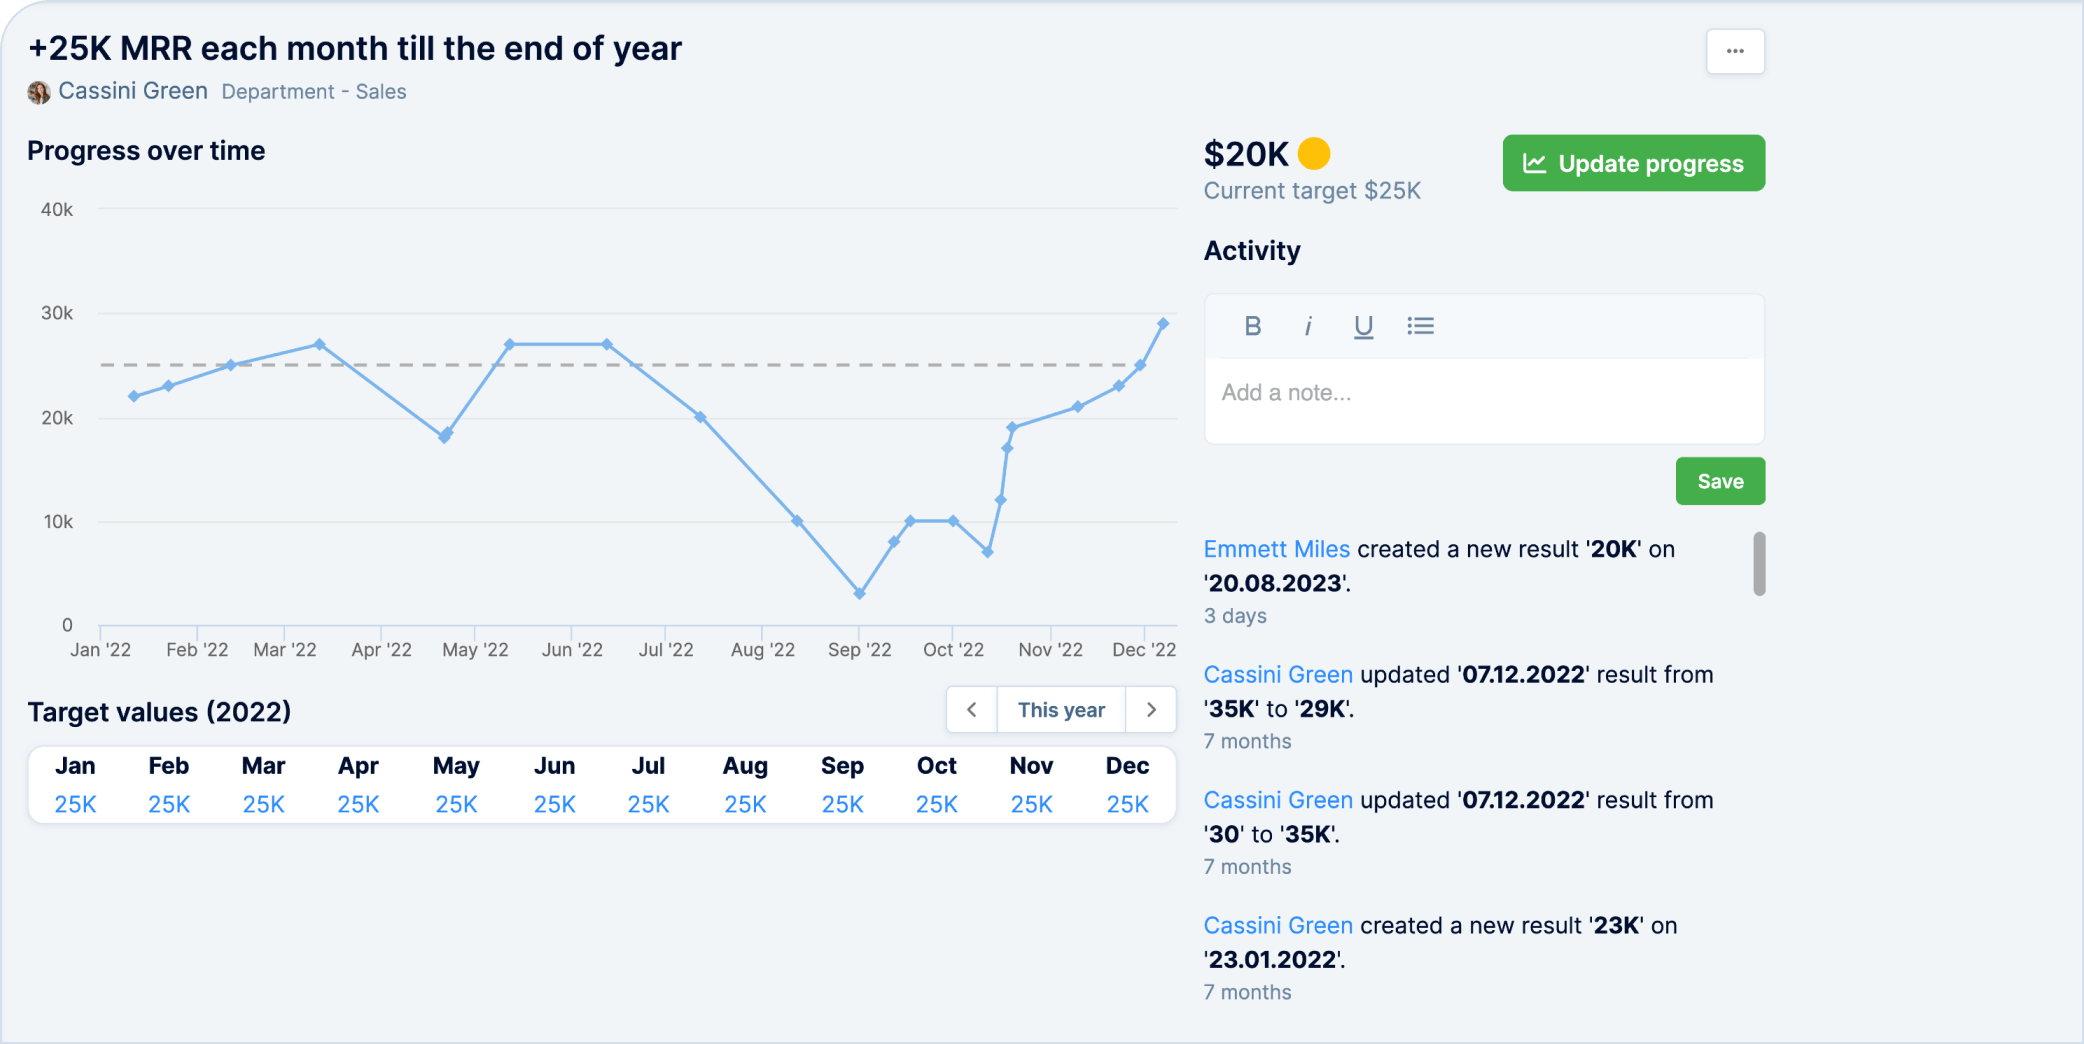
Track, manage, and visualize your company's progress with customized performance indicators. Set metrics by employee, department, division, or project, and let our system generate dynamic graphs to keep you informed and in control. Take charge of your business's growth and make data-driven decisions with ease.
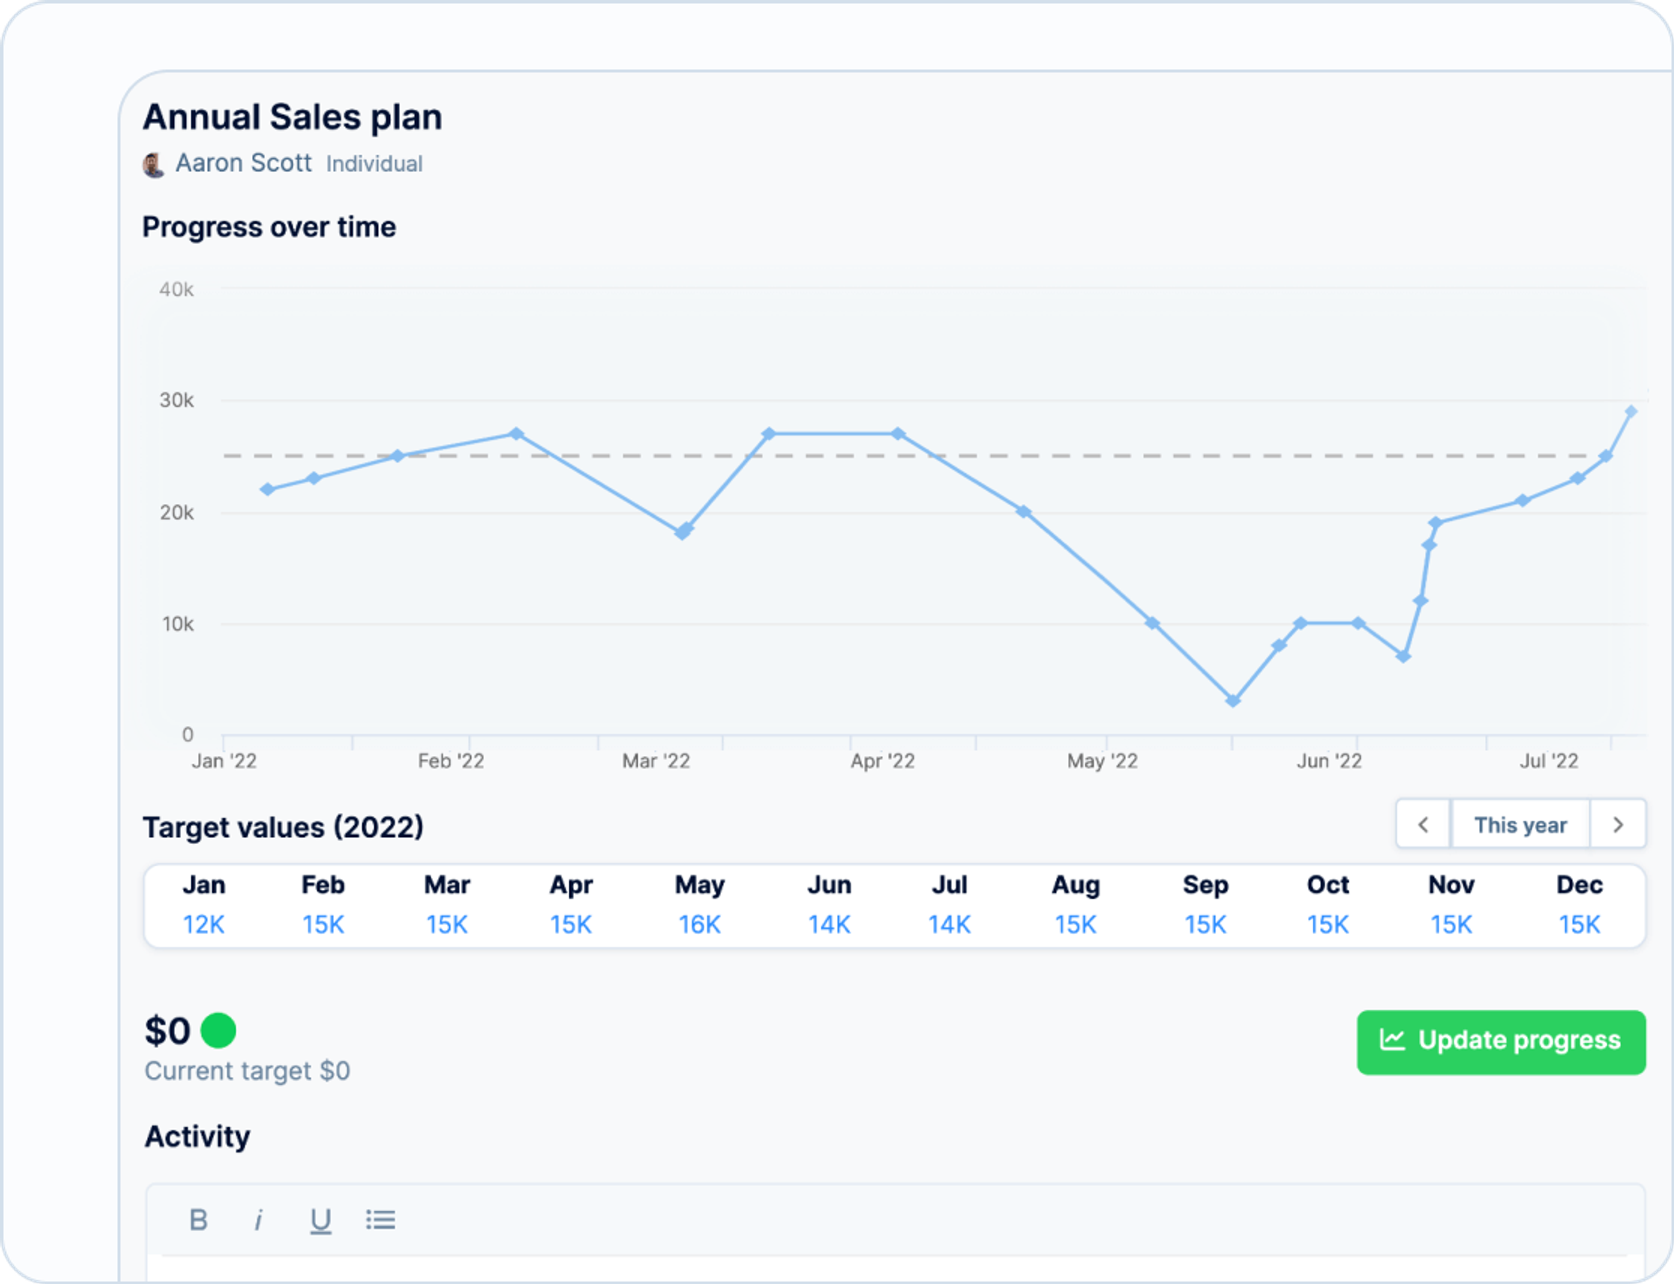
Take control of your KPIs with a personal dashboard
Ignite your employees' drive with the "KPIs" section on their “Me” page. It’s where your team can effortlessly track, update, and analyze its performance. Interactive graphs and real-time progress updates propel them towards their goals, ensuring faster achievement and greater satisfaction.
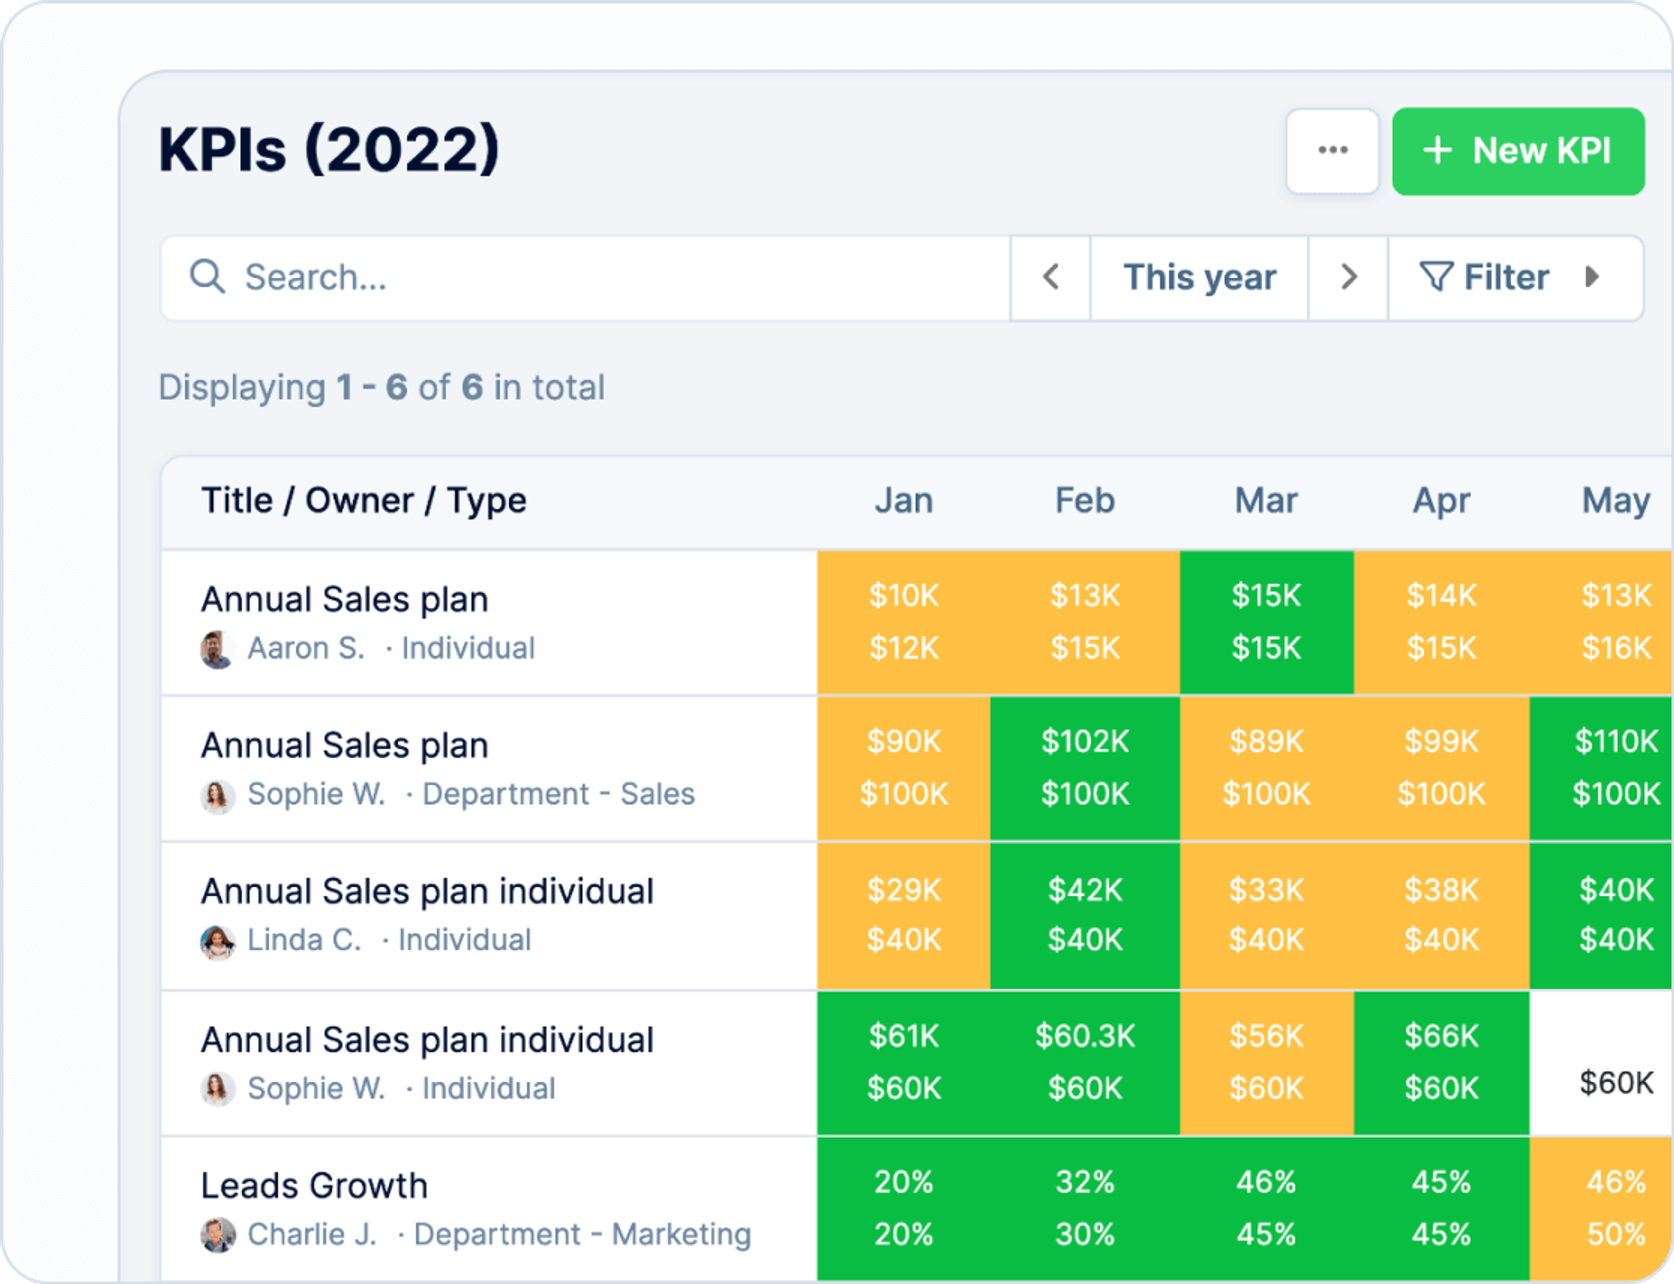
Analyze KPIs using interactive widgets and graphs
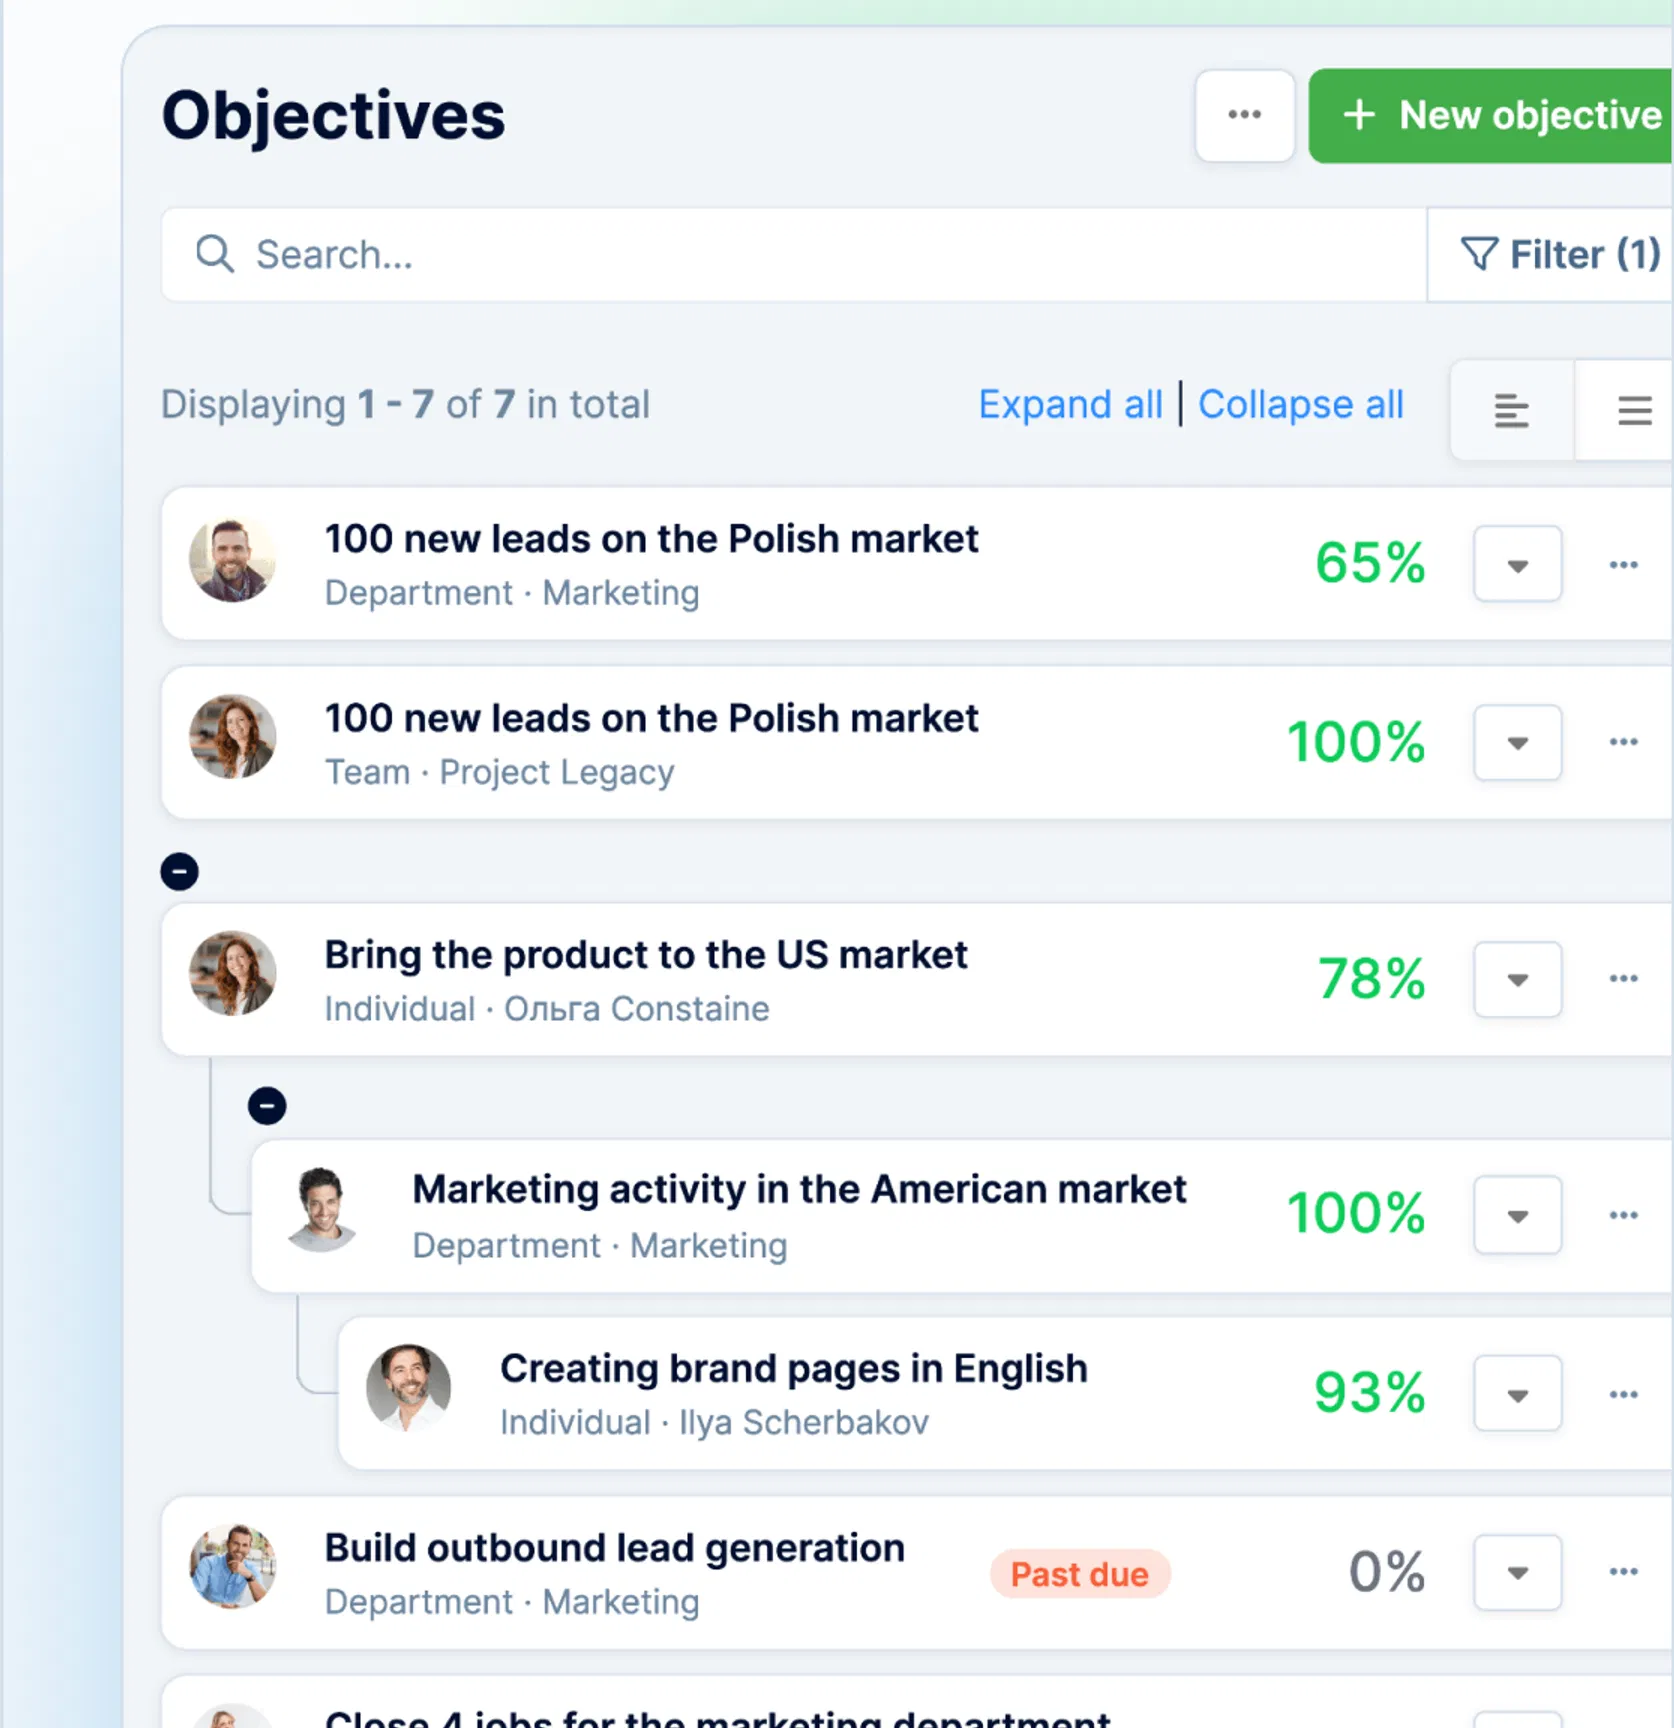
Dive into the PeoplePerform section, where you'll find comprehensive analyses featuring all company KPIs and widgets highlighting planned objectives and at-risk targets. Effortlessly filter and visualize objective indicators to track their progress with dynamic graphs.
See more functionalities offered by PeopleForce
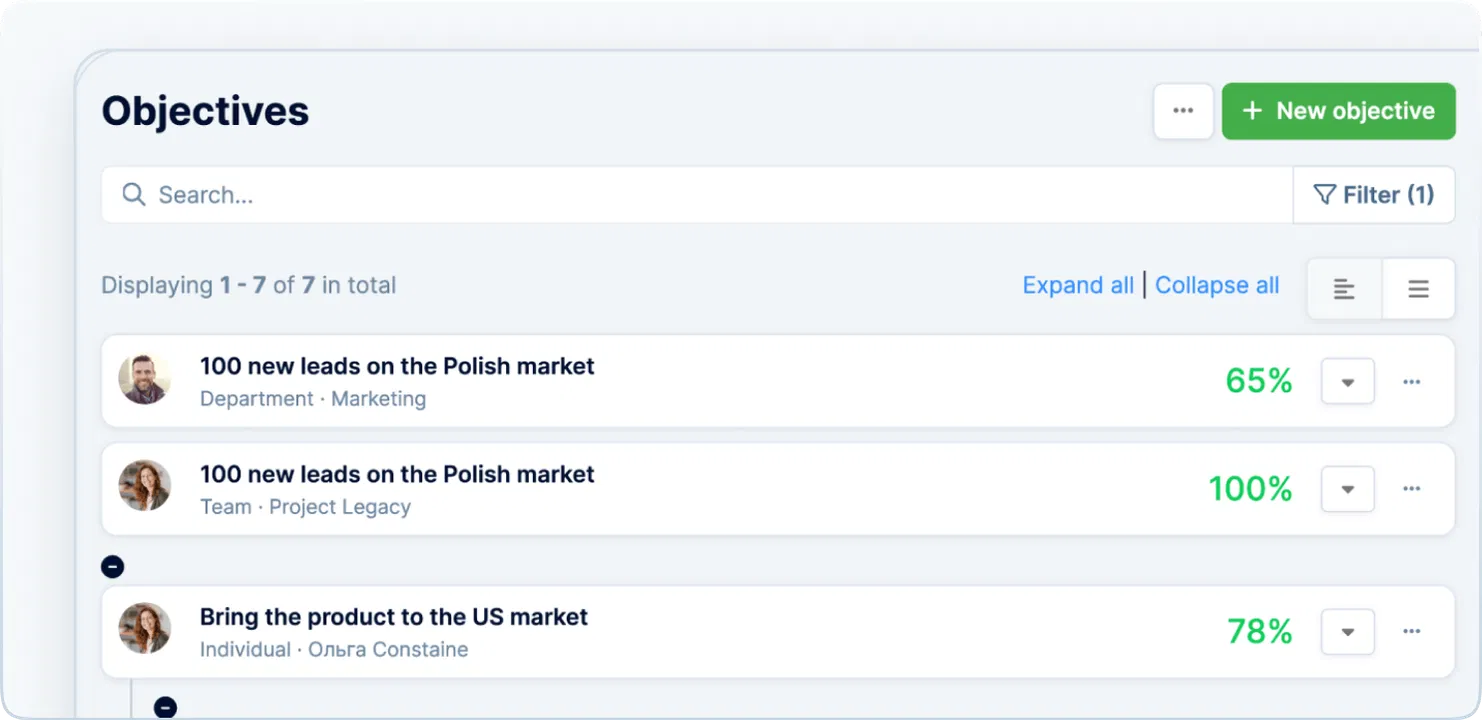
OKR Management
Empower growth and alignment by connecting individual contributions to company objectives. Build effective processes and drive meaningful progress with our OKR feature.
Learn more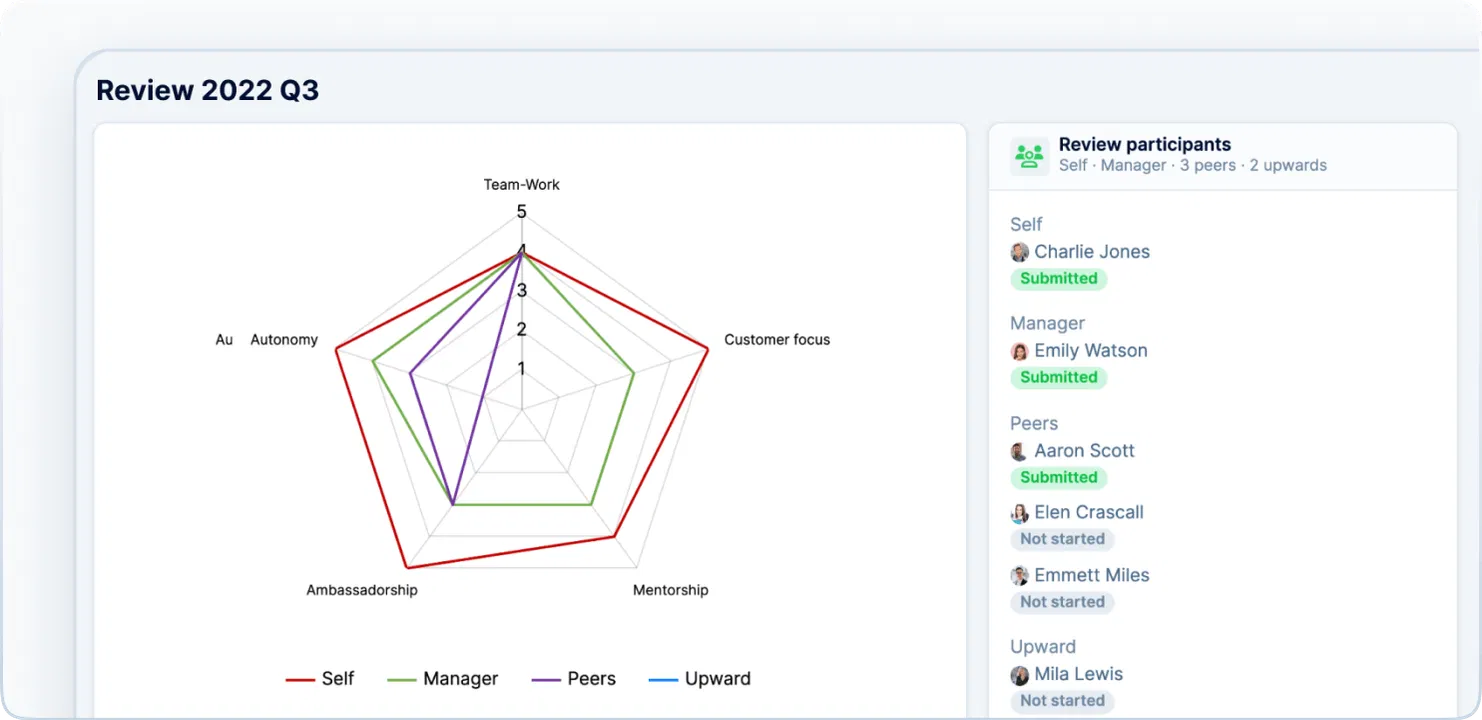
Performance reviews
Leverage an employee performance management system that facilitates performance reviews, enabling effective one-on-one meetings with your team members.
Learn more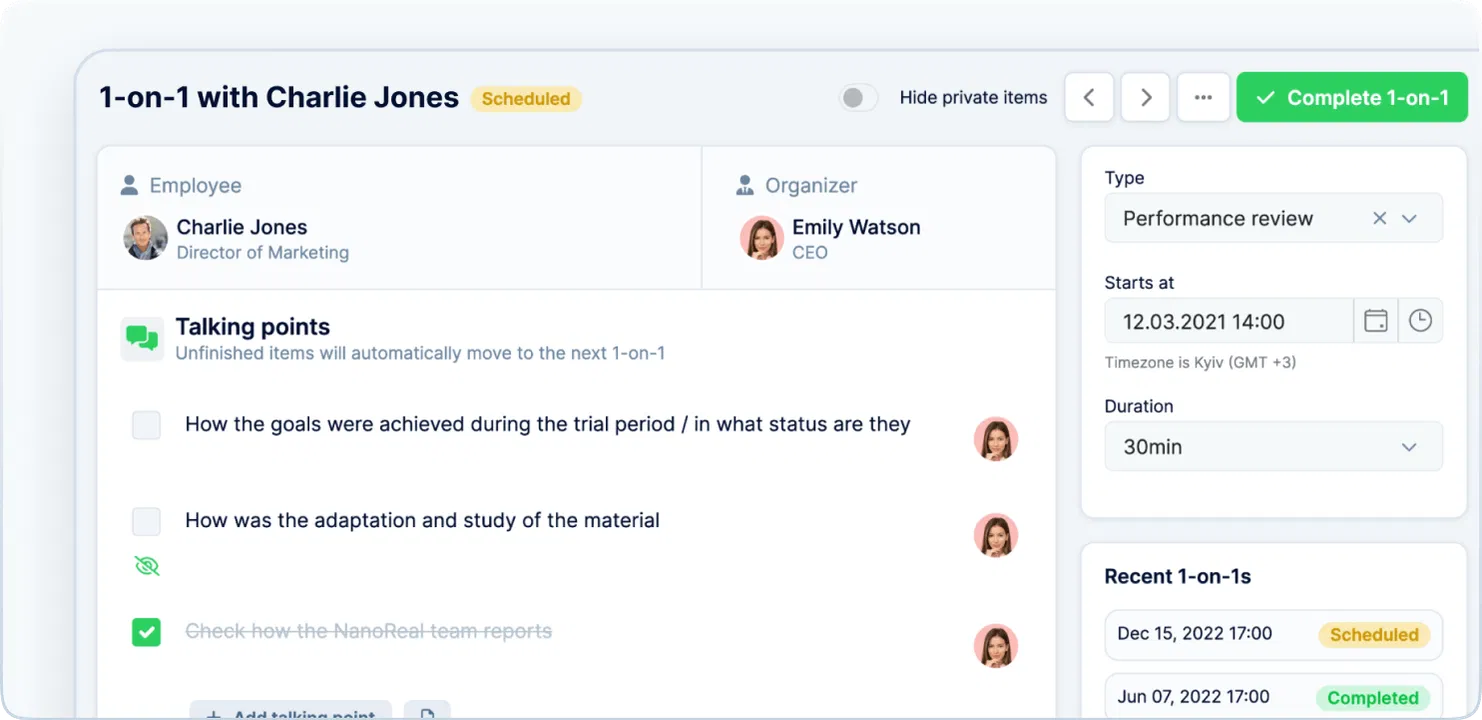
1-on-1 meetings
Boost team performance with a powerful 1-on-1 meetings tool. Engage in open dialogues about expectations, tasks, and goals using our convenient platform.
Learn moreWhy choose PeopleForce?
We are delighted to have you with us. Our platform is designed to help you get set up quickly and easily, so you can focus on doing your best work.
Top-rated HR platform to streamline your HR processes
Request a demo
Self-service for your employees
Each employee can see the directory of team members, a calendar with upcoming events, their tasks and goals, and in one click, request sick leave or vacation.
Flexible leave management
No more spreadsheets! Customize your leave types and balance calculation, and fully automate the leave request and approval system for team members' convenience.
HR reporting & analytics
Get actionable insight into every facet of your HR process. PeopleForce makes it easy to create quick, custom, and precise reports.
HR workflow automation
Create and manage workflows of any complexity to plan and execute the most intricate processes within your company.
Integrations
Integrate your Google, Microsoft, and popular social media and messengers for easy communication, scheduling appointments in your calendar, and quick sign-in.
Applicant tracking system
Discover the potential of an intuitive candidate search system, allowing recruiters to customize it according to the company's needs and unearth exceptional talents.
Goals management
Effortlessly monitor employee KPIs and OKRs, actively craft personalized development plans, and easily ensure your team members' effectiveness.
Performance reviews
Maximize employee effectiveness and unlock their full potential through automated performance reviews on the PeopleForce platform.
Automated pulse surveys
Seeking team feedback? Discover the power of automated surveys for valuable insights. Capture loyalty levels and thoughts effortlessly with popular built-in templates.
Check out our customers' testimonials
Check out what real customers have to say about their experience with PeopleForce.
It was really easy and fast to move from google sheets to PeopleForce! Everything is super intuitive and takes a minimal amount of time to set up. The onboarding team is great- they were always ready to answer your questions during the process. Also, the best thing is that customer support listens to your feedback and we have already implemented a few features from our feedback!
When I looked for the new HRMS, I was impressed with the flexibility of PeopleForce, where you can make whatever you need: access rights, automated flows, leave policies, recruitment process, and performance reviews can be configured precisely how you need them. The UI is intuitive, so new users adapt very quickly.
PeopleForce really boils down to your needs and workflow. It's very suited for medium-sized companies that want to automate their HR workflows, from presence logging to performance reviews. It's modular and very customizable, and you can see it evolve constantly, release after release.
Support managers are quick to respond and always available. With the nice interface of the platform, everything works without problems. Conveniently adjusted to our individual requests. Some features we would like to add, written about it to technical support and our wishes will be considered in the next releases. This is very pleasant and speaks of high-quality service.
The system is quite deep in terms of functioning. After the initial data import, it is quite intuitive to implement all the processes and even so, the Customer Success team is always available for a quick sync or an extensive implementation meeting. Overall we had 5 implementation meetings after which I felt quite confident to present the system to the rest of my team.
There's a lot to appreciate about PeopleForce. Firstly, their PTO tracking is seamless – a real time-saver. The ability to customize features adds a personal touch that's impressive. The 1-on-1 feature in the performance module is a standout, making interactions meaningful. Workflows and flexible settings are like a dream combo, tailored to our needs.
PeopleForce is a great tool that helps to structure and maintain main HR core processes in one place. It saves a lot of time when it comes to the operational part. The platforms are constantly developing by providing new and new opportunities while the price remains the same. Their Customer Service is super attentive and helpful. Great job, guys!