
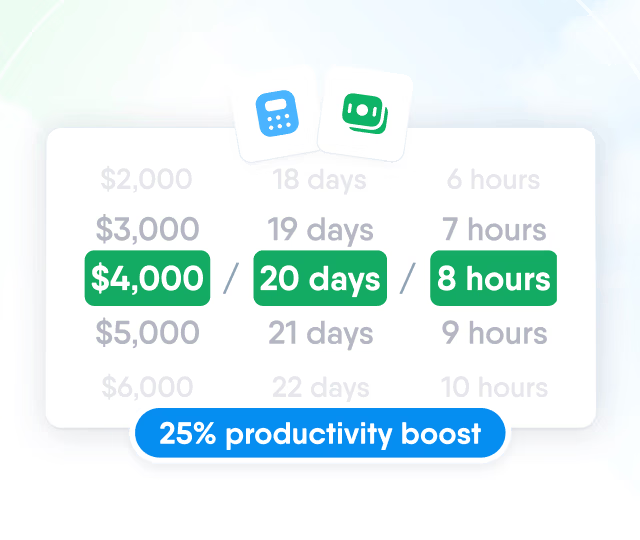
HR efficiency estimator
How does the HR efficiency estimator from PeopleForce work.
Calculate your impact



Employee KPIs: how to set them, measure them and keep motivation intact

A KPI (key performance indicator) is a numeric measure that shows how well a role, team or process is delivering the result it exists for. Achievement on a single KPI is calculated as actual ÷ target × 100%. An employee's overall score is the sum of their achievement on every KPI, multiplied by each KPI's weight.
A working set is three to five KPIs per role, each with its own data source. If there are more than seven, or if even one of them is calculated by hand on gut feel, the system will not survive a single quarter.
KPI or KPIs?
The singular is KPI and the plural is KPIs. “KPI indicators” is technically redundant, since the I already stands for indicator, but you will still see it in job ads and dashboards. In policies and contracts, stick to KPI or key performance indicator.
What a KPI is and what it is not
Three terms get mixed up all the time, and that confusion is where broken KPI systems come from.
- Metric: any number you can measure, such as calls, visits or requests.
- KPI: a metric that reflects the outcome of the role and that the person can genuinely influence.
- Target: the number to reach within the period.
The number of calls is an activity metric. The conversion rate from call to meeting is a KPI, because it shows the quality of the work rather than the amount of movement.
Types of KPIs
Pair | What it means | Example |
|---|---|---|
Quantitative / qualitative | The first are calculated automatically, the second need an assessment or survey | Sales volume / service quality score |
Leading / lagging | The first predict the result, the second record what has already happened | Qualified leads / monthly revenue |
Individual / team | The first depend on one person, the second on shared work | Personal sales target / time to fill a vacancy |
Absolute / relative | The first in units, the second in percentages or ratios | 200 closed tickets / 65% first contact resolution |
A practical rule: every set needs at least one leading indicator. If all your KPIs are lagging, managers learn about a problem only when it is too late to change anything.
How to set KPIs step by step
Step 1. Define the outcome of the role
Not a list of duties, but an answer to the question: what is the company paying this role for? For a recruiter, it is not “interviews held” but “vacancies filled with people who passed probation”. If the outcome of the role is not defined, the KPIs will end up measuring activity.
Step 2. Choose 3 to 5 KPIs
Each KPI must pass a control test: can this person move the number through their own actions? Company-wide profit in a warehouse supervisor's KPIs is a classic example of a measure that only demotivates.
Step 3. Set a baseline and a target
The baseline is actual performance over the last three to six months, not what the manager would like to see. The target is set from the baseline, not from the ceiling. A target that is impossible from day one works exactly like having no target at all.
Step 4. Name the data source
For each KPI, write down which system the number comes from, who pulls it and how often. A KPI without a source is a future argument at the end of the period.
Step 5. Agree it with the employee
The employee needs to understand how each number is calculated and what they can do to move it. A KPI that someone first discovers on their payslip does not change behaviour.
KPI examples by department
Sales
- Revenue target achievement, %
- Conversion from qualified lead to deal, %
- Average deal size
- Sales cycle length, days
- Contract renewal rate, %
Marketing
- Cost per qualified lead
- Qualified leads per month
- Website to enquiry conversion, %
- Share of revenue attributed to marketing, %
Customer support
- First response time
- Time to full resolution
- First contact resolution, %
- Customer satisfaction after contact
- Repeat contact rate, %
Engineering
- Lead time from task start to release
- Share of releases rolled back, %
- Defects found in production
- Time to recover after an incident
HR and recruitment
- Time to fill, days
- Cost per hire
- New hires who pass probation, %
- Voluntary turnover, %
- Vacancies filled by internal candidates, %
Finance
- Cash flow forecast accuracy, %
- Month-end close, working days
- Overdue receivables, %
- Reporting errors found after submission
Warehouse and logistics
- Stock accuracy after stocktake, %
- Orders picked on time, %
- Picking error rate, %
- Cost per order processed
Retail
- Sales per square metre
- Footfall to purchase conversion, %
- Average items per transaction
- Shrinkage (write-offs, shortages), %
How to calculate KPI achievement
Achievement on one KPI: actual ÷ target × 100%. Overall score: the sum of (achievement × weight). The weights always add up to 100%.
KPI | Weight | Target | Actual | Achievement | Weighted |
|---|---|---|---|---|---|
Revenue | 50% | £1,000,000 | £900,000 | 90% | 45.0% |
Lead → deal conversion | 30% | 20% | 23% | 115% | 34.5% |
Renewal rate | 20% | 80% | 72% | 90% | 18.0% |
Total | 100% | 97.5% |
Two technical details that are often missed. First, for KPIs where lower is better (lead times, losses, turnover), the formula is inverted: target ÷ actual × 100%. Second, cap achievement on any single KPI at 120 to 150%, otherwise one unusually large deal will hide poor results everywhere else.
Linking KPIs to bonuses without doing damage
When all pay depends on the numbers, people start optimising the numbers instead of the work: closing tickets without solving them, moving deals between months, picking the easy vacancies. This is not a question of honesty but a predictable reaction to the incentive.
- Keep a fixed component. For most roles, a healthy split is a larger fixed salary with a variable element on top as a reward for results. Fully variable pay only makes sense in classic sales roles.
- Set a threshold. The bonus starts paying out from a certain level of achievement, for example from 80%.
- Cap the upside. A maximum payout at 120 to 150% protects against one-off anomalies.
- Add a quality brake. A volume KPI only works alongside a quality KPI: churn, returns, repeat contacts.
- Do not change the rules mid-period. Adjustments happen at the start of the next cycle, otherwise the system loses trust in one go.
In the UK, if a bonus is contractual, its rules are part of the employment terms, so changing them without agreement can amount to a breach of contract. Keep the KPI and bonus rules in writing, in the contract or a separate bonus policy, and state clearly whether the bonus is contractual or discretionary.
KPIs work best for stable processes. When the goal is change, OKRs tend to work better. The differences between the two approaches are covered in OKRs vs. KPIs: choosing the right framework.
Common mistakes
Too many KPIs. Ten KPIs mean none of them matters.
KPIs the person cannot control. Company margin in an assistant's KPIs is noise, not management.
Metrics without a data source. The number comes from a manual spreadsheet and gets disputed every month.
Unreachable targets. A target nobody has ever hit reads as a decision not to pay the bonus.
Quantity only. Without a quality metric, the team grows volume at the customer's expense.
Reviewing once a year. KPIs stay in place for years even though the process has changed twice.
KPI matrix template
KPI | Weight | Data source | Baseline | Target | Actual | Achievement | Comment |
|---|---|---|---|---|---|---|---|
_______ | __% | _______ | ___ | ___ | ___ | __% | _______ |
_______ | __% | _______ | ___ | ___ | ___ | __% | _______ |
_______ | __% | _______ | ___ | ___ | ___ | __% | _______ |
Total | 100% | __% |
The “data source” column matters more than all the others. It is the reason the matrix survives past month three.
Where to keep KPIs between periods
A spreadsheet matrix works right up until the team grows past twenty people. In the Perform module, KPIs live in the employee profile alongside goals: each one has a metric, a baseline and target value, an owner and a weight, and achievement is calculated automatically.
The biggest payoff comes in the review cycle: the manager sees actual KPI achievement next to the competency assessment for the same period, instead of two separate files. Reports break down by department, location and manager, so you can see whether a KPI is being missed by one person or by an entire team. The second usually points to a problem with the target, not the people.
Frequently asked questions
What is a KPI in simple terms?
It is a number that shows how well a role or team is delivering its result. Achievement is calculated as actual divided by target, expressed as a percentage.
How many KPIs should one employee have?
Three to five. Fewer than three gives a one-sided picture; more than seven and the person loses focus and the KPIs turn into reporting.
How do you calculate KPI achievement as a percentage?
Divide actual by target and multiply by 100%. For KPIs where lower is better, invert it: target divided by actual. The overall score is the sum of each achievement multiplied by its weight.
What is the difference between KPIs and OKRs?
A KPI monitors a stable process and is expected to hit 100%. An OKR describes a change within a specific cycle, and a healthy score there is 60 to 80%. The full comparison is in OKRs vs. KPIs.
Can you set KPIs for back-office roles?
Yes, but through deadlines, accuracy and error rates rather than revenue. Examples: month-end close time, share of documents processed on time, number of reporting errors.
How often should KPIs be reviewed?
Targets every quarter; the KPI set itself every six months or after a significant change to the process. The rules are not changed within a period.
The PeopleForce editorial team creates and refines content on people management, recruiting, team development and HR technology. Every article goes through an editorial review for accuracy, relevance and clarity. We rely on verified sources, industry research, hands-on experience and PeopleForce’s own analytics, including anonymized data, to give HR professionals, managers and business owners useful, reliable information.


One login. Every HR tool you'll need.
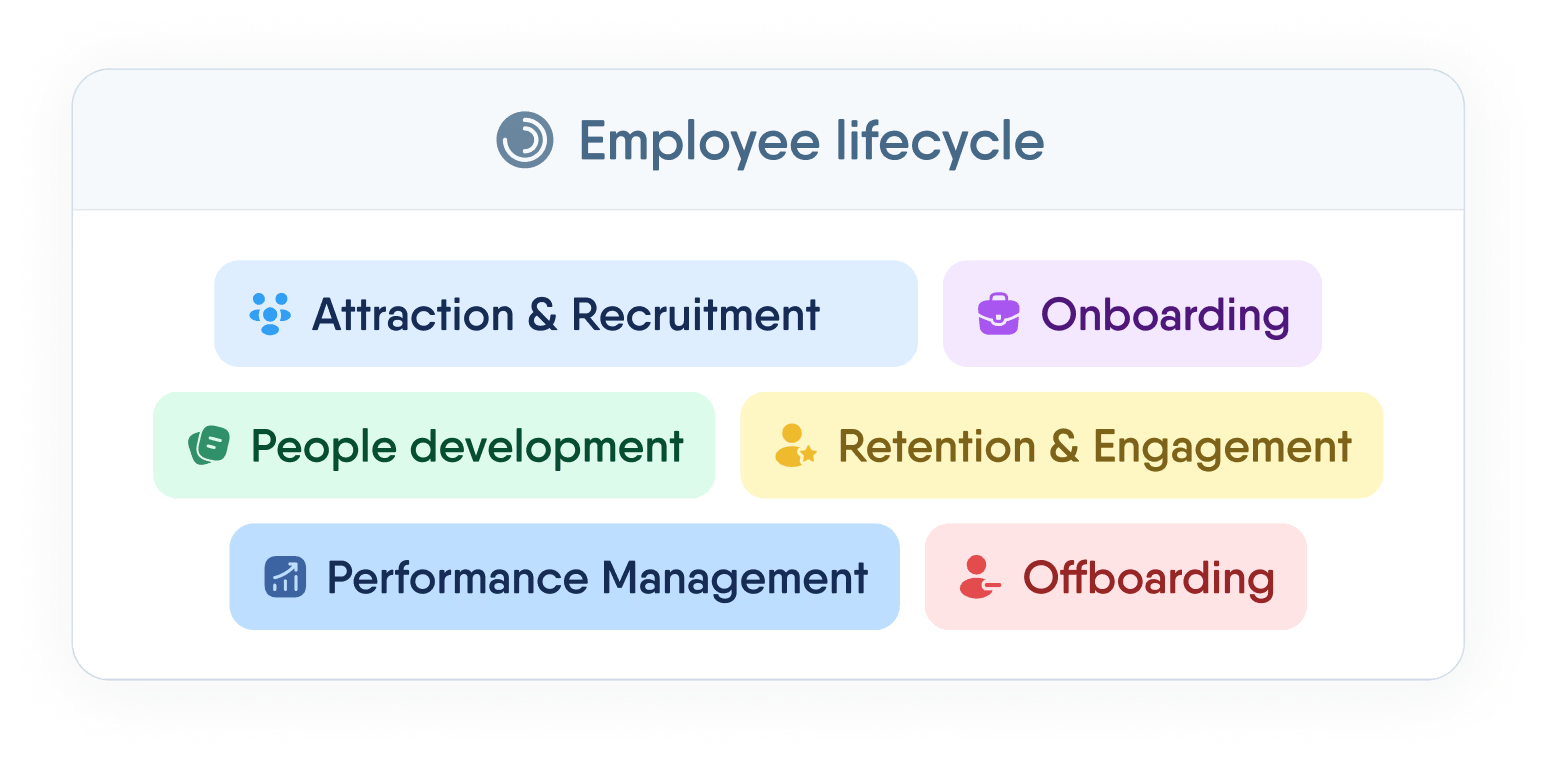
Manage the full employee lifecycle — from first interview to final offboarding — without switching tabs or losing data.
Recent articles
Soft skills vs hard skills: the difference and how to assess them
The difference between soft and hard skills, 30 soft skills explained, hard skills by profession and 18 behavioural interview questions.
Job offer: what to include, template and examples for Ukraine and the UK
Legal status of a job offer in Ukraine and the UK, what to include, a template, examples by role type and negotiation tips.
Job description: templates and example duties for Ukraine and the UK
Structure of a job description in Ukraine and the UK, two templates, rules for wording duties and example duties by role.