
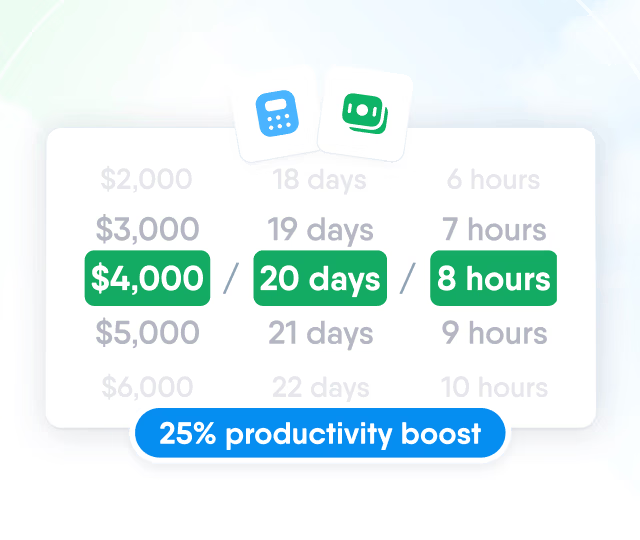
HR efficiency estimator
How does the HR efficiency estimator from PeopleForce work.
Calculate your impact



9-box grid
What the 9-box grid is, what each of the nine cells means and implies, how it drives talent reviews, succession and development, where it goes wrong and how to run it fairly, and how review data can generate it automatically
The 9-box grid (nine-box grid, performance-potential matrix) is a talent review tool that places employees on a three-by-three grid according to two ratings: how well they perform in their current role and how much potential they show for taking on bigger ones. Performance runs along one axis from low to high, potential along the other, and each of the nine resulting cells implies a different talent decision, from fast-track development for the top corner to a hard conversation for the bottom one. It was popularized by General Electric in the 1970s as a way to compare business units and was later adapted for people, and it remains the most widely used format for succession and talent calibration meetings because it forces leaders to separate two things they usually blur: results today and capacity for tomorrow.
The nine boxes and what they mean
Labels vary between companies, but a common set reads as follows. High performance, high potential: Star. Ready for a bigger role now; the priority is retention and a stretch assignment before someone else offers one. High performance, medium potential: High performer. Excellent in role, likely to grow one step; invest in development and keep them challenged. High performance, low potential: Solid performer. The backbone of the team, valuable exactly where they are; recognize and retain rather than push into management. Medium performance, high potential: High potential. Results not yet matching capability, often a new hire or someone in the wrong seat; coach and consider a move. Medium performance, medium potential: Core player. Reliable and steady; targeted development for specific gaps. Medium performance, low potential: Average performer. Meets the bar; keep expectations clear and look for efficiency gains. Low performance, high potential: Potential gem. Something is blocking a capable person, whether the role, the manager or a personal situation; diagnose before deciding. Low performance, medium potential: Inconsistent player. A performance plan with a defined timeline. Low performance, low potential: Risk. A structured conversation about fit, and an exit if it does not change.
How the 9-box grid is used
Its main home is the talent review or calibration meeting, where managers from a division place their people on the grid together and challenge each other's placements, which surfaces inflated ratings and neglected talent at the same time. From there it drives succession planning: the top-right cells are the pool of successors for critical roles, and an empty top-right corner is a warning about the leadership pipeline. It shapes where development budget goes, since a high-potential employee and a solid performer need different investments, and it informs retention decisions on pay and promotion. Read across the whole company, the distribution of people on the grid tells leadership whether the organization is growing its own future managers or will have to hire them.
Limits and how to use it well
Performance is measurable; potential is a judgment, and judgments are where bias lives. Without a definition, potential defaults to resembling the people already at the top, so define it in observable terms such as learning agility, ability to handle ambiguity and track record of growing others. Calibrate in a group rather than letting each manager place alone, and require evidence for every placement. Keep the exercise confidential: telling people their box turns a development tool into a label that demotivates everyone outside the top-right corner. Treat the grid as a snapshot and repeat it at least annually, because people move. And do not let it replace conversation: the grid decides who to talk to about what, it does not replace the one-on-one where the development plan is actually agreed.
9-box grid in PeopleForce
In PeopleForce Perform the 9-box grid is generated from the performance review rather than filled in by hand. Every review cycle includes dedicated potential and performance questions alongside the competency assessment, so when managers complete their reviews each employee receives a performance rating and a potential rating on the same evidence base. The results are plotted automatically on a nine-box view with the cells labelled from Risk to Star, filterable by department and manager, which gives HR the calibration picture for the whole company without a spreadsheet and lets leaders compare distributions between teams. Because the placement sits on the employee record next to competency scores, past reviews and one-on-one notes, the conversation that follows is grounded in what was actually observed, and the outcome, whether a development plan with action items or a succession nomination, is created in the same place.


Let us show you what's possible
From Core HR to advanced workforce analytics — see the platform saving 80 hours a month for teams just like yours. Fully tailored to your workflow.