
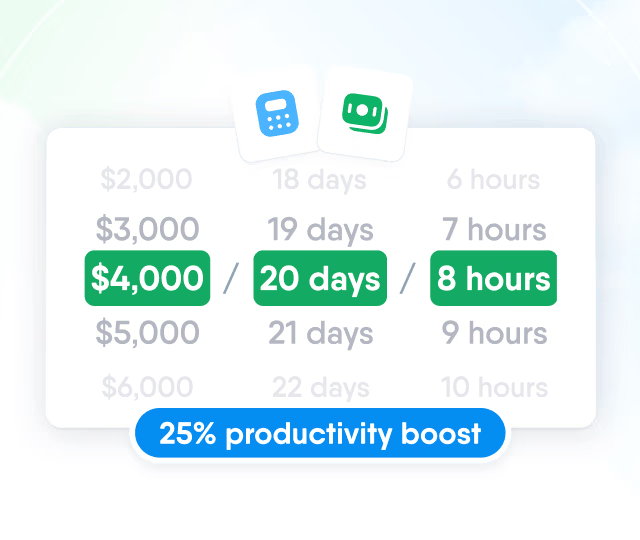
HR efficiency estimator
How does the HR efficiency estimator from PeopleForce work.
Calculate your impact



Types of organizational charts: vertical, horizontal, matrix and circular, with examples

An organizational chart is a map of a company's structure: it shows which departments exist, who leads each one and who reports to whom. The most common types are vertical, horizontal, matrix, circular and flat. The right one depends on how many management levels you have and how decisions are made in your team.
For the short definition, see what an org chart is. Here you will find each type with an example, when it fits and how to build your own.
Org chart types at a glance
| Type | How it reads | Use it when |
|---|---|---|
| Vertical | Top to bottom, by levels of authority | The hierarchy is clear and there are several management levels |
| Horizontal | Left to right, leadership on the left | You need to show wide departments on a single page |
| Matrix | Rows by function, columns by project or product | People report to two leaders at once |
| Circular | From the centre outwards, in rings | You want to show closeness between teams rather than rank |
| Flat | One management level over the whole team | The company is small or works in autonomous teams |
Vertical org chart
The most common format. Leadership sits at the top, with departments, team leads and teams opening up below. Each line is a direct reporting relationship, so it reads fast: one look tells you who decides what.
Example: an 80-person distributor. The general manager is at the top; below are sales, logistics and finance; below each of them, their teams. If the company grows by department and authority is clearly defined, this format is enough.
The limit shows up with many levels. A chart five or six levels deep is hard to print and read, and it is often a sign to review each leader's span of control.
Horizontal org chart
It shows the same hierarchy as the vertical one, but left to right. Leadership is on the far left and the levels unfold to the right. It helps when one department has many parallel teams and a vertical layout would not fit on one page.
Example: a contact centre with twelve supervisors under one operations manager. Vertically, that is twelve boxes in a row; horizontally, it reads like an ordered list.
Matrix org chart
It crosses two axes: functions (rows) and projects or products (columns). Each person sits at an intersection and reports to two leaders, one for the function and one for the project. It is typical for consultancies, agencies and software companies. A matrix organization has clear benefits, but it needs rules: who sets priorities and who assesses performance when the two leaders disagree.
Example: at an advertising agency, a designer reports to the art director (function) and to a client account lead (project). The chart shows both lines.
Circular org chart
Leadership sits in the centre and the levels open outwards in rings. It does not remove hierarchy; it shows it as closeness to the centre instead of height. Companies choose it to signal collaboration between teams, for example in internal presentations or during onboarding.
For day-to-day use it is awkward: with more than 40 or 50 people the rings get crowded and reporting lines are hard to follow.
Flat org chart
There is one management level between leadership and the team, or none. It is common in startups, in teams under 20 people and in companies built around autonomous teams. It reads in seconds, but as the team grows, a leader with 15 or 20 direct reports no longer has time for each of them.
Other formats you will come across
A divisional chart groups people by product, customer or region and suits companies with several business units. A hybrid chart combines, for example, a vertical structure overall with a matrix inside the projects department. Both are variants of the five types above rather than separate structures.
How to choose an org chart type
Count the management levels. Up to three or four, a vertical chart works. More than that, try horizontal or review the structure.
Look at how work is assigned. If people work on projects with two leaders, a matrix chart reflects reality better than anything else.
Think about the audience. HR and leadership need detail; for a company-wide presentation, departments and their leaders are often enough.
Decide how often you will update it. An outdated org chart confuses more than having none.
How to build an org chart step by step
List departments and roles. Start from your current headcount, not the ideal structure.
Define reporting lines. For each person, who they report to directly. Mark any dual reporting.
Choose the type using the criteria above.
Decide what each box shows: name, job title, department, photo. Less data reads better.
Check it with each department head before sharing it.
Make someone responsible for keeping it current when people join, leave or change roles.
The last step is the one that usually fails. In a spreadsheet or a slide, the chart goes out of date with the first role change. That is why it works best when it is built from employee profile data, as part of your organizational structure.
The org chart in PeopleForce
In Core HR, the org chart is generated from the reporting lines in employee profiles. It has two views: by people, showing who reports to whom, and by departments. You can filter the chart to a single department or group and export what is on screen to PDF.
When someone joins, leaves or changes manager, the change is made in their profile and the org chart updates automatically, with no file to redo.
Frequently asked questions
What are the most common types of org charts?
Vertical, horizontal, matrix, circular and flat. The vertical chart is the most common because it shows the hierarchy directly.
What is the difference between a vertical and a horizontal org chart?
The content is the same: both show the same hierarchy. Only the reading direction changes. A vertical chart runs top to bottom; a horizontal one runs left to right and fits better on a page when a department has many teams.
When does a matrix org chart make sense?
When people report to two leaders, one for their function and one for the project or product. It is common in consultancies, agencies and software companies.
How often should an org chart be updated?
Every time someone joins, leaves or changes manager. If it is built from employee profiles in an HR system, it updates automatically.
What should each box in an org chart show?
At minimum: name, job title and department. A photo helps in large companies or remote teams. More data makes the chart hard to read.
The PeopleForce editorial team creates and refines content on people management, recruiting, team development and HR technology. Every article goes through an editorial review for accuracy, relevance and clarity. We rely on verified sources, industry research, hands-on experience and PeopleForce’s own analytics, including anonymized data, to give HR professionals, managers and business owners useful, reliable information.


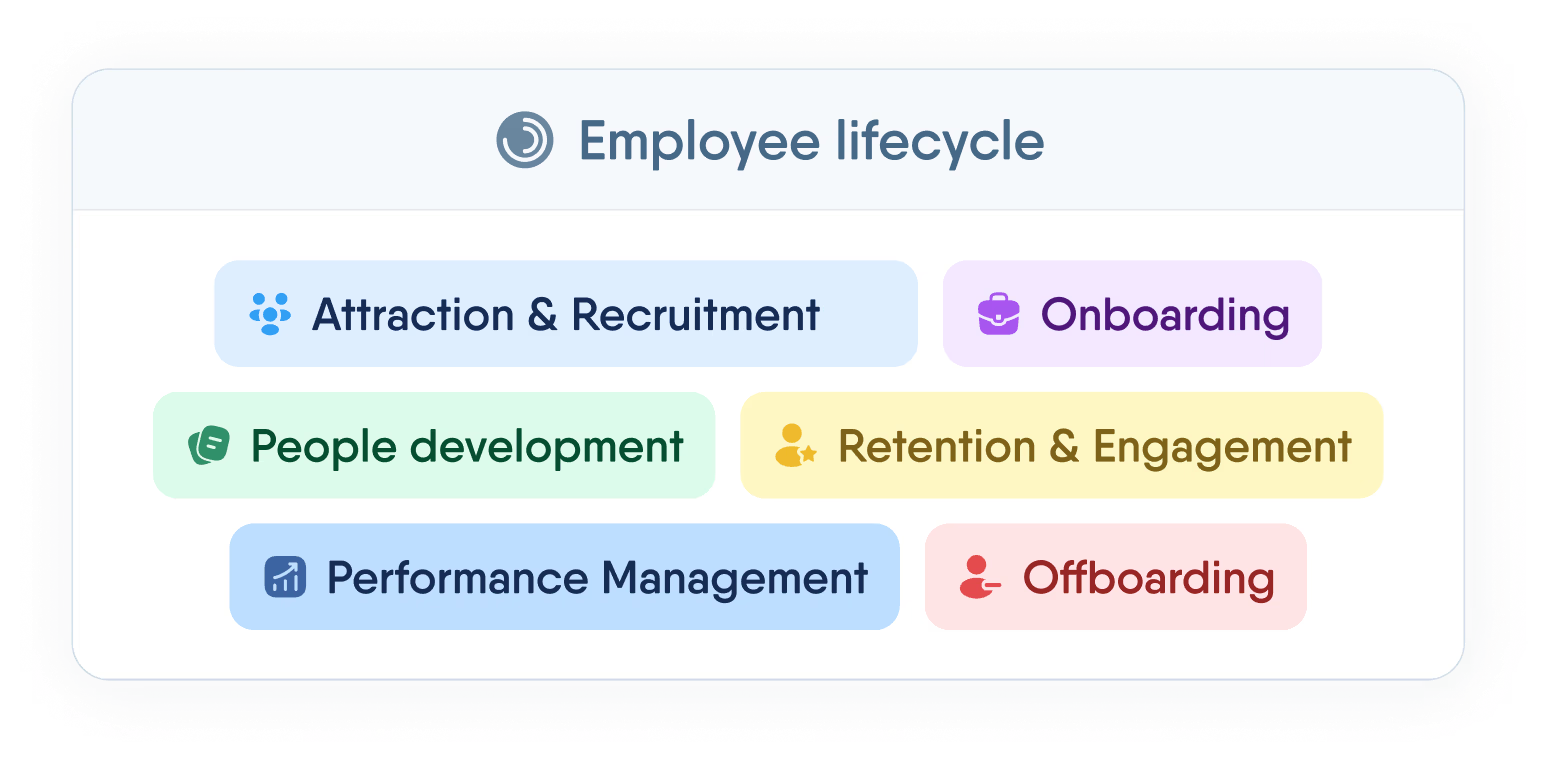
One login. Every HR tool you'll need.
Manage the full employee lifecycle — from first interview to final offboarding — without switching tabs or losing data.
Recent articles
 2026-11-12
Reference check: how to verify a candidate and what to ask
What a reference check is, when to run it, how to get candidate consent, which questions to ask referees and how to read their answers.
2026-11-10Workplace climate: what it is, types, how to measure it and what to do next
What workplace climate means, the main types and dimensions, sample climate survey questions and how to turn the results into an action plan.
2026-11-10Time and attendance system: what it is, types and how to implement it
What a time and attendance system does, which type fits which team, what Polish and UK law require for working time records and how to implement it.